Estimated Value: $311,000 - $406,000
3
Beds
2
Baths
1,649
Sq Ft
$204/Sq Ft
Est. Value
About This Home
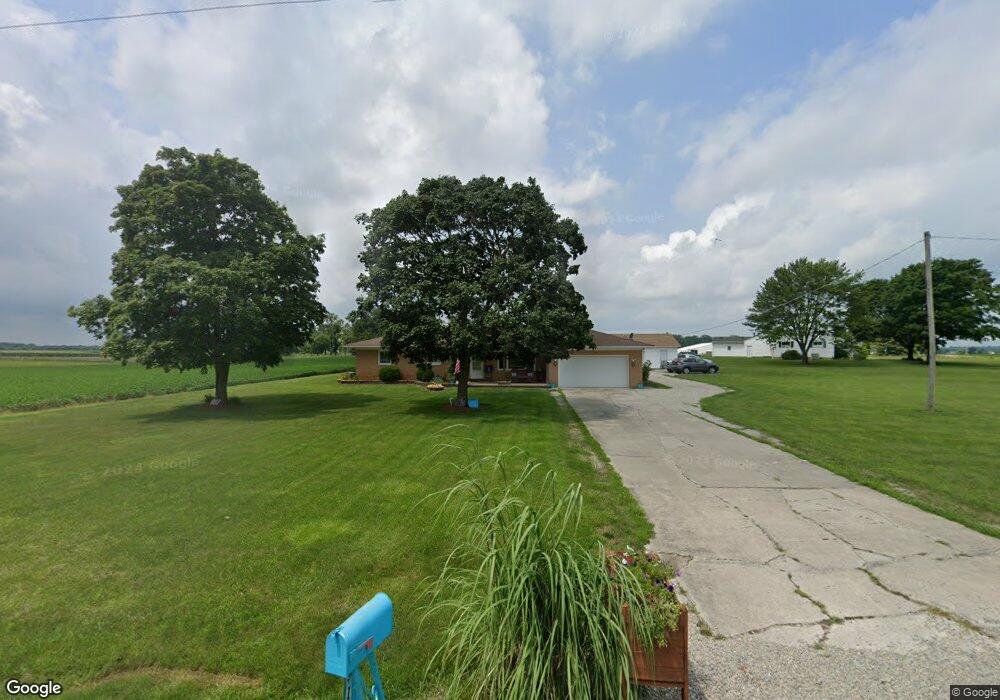
This home is located at 9510 Mulberry Grove Rakestr Rd, Piqua, OH 45356 and is currently estimated at $336,788, approximately $204 per square foot. 9510 Mulberry Grove Rakestr Rd is a home located in Miami County with nearby schools including Washington Primary School, Piqua Junior High School, and Piqua High School.
Ownership History
Date
Name
Owned For
Owner Type
Purchase Details
Closed on
Jan 9, 2025
Sold by
Grilliot Nicholas P and Grilliot Kimberly E
Bought by
Grilliot Family Revocable Trust and Grilliot
Current Estimated Value
Purchase Details
Closed on
Aug 3, 2020
Sold by
Grilliot Nicholas P and Grilliot Kimberly E
Bought by
Ely Rus A and Ely Amy L
Purchase Details
Closed on
Jul 24, 2008
Sold by
Williams Lori J and Williams Ronald A
Bought by
Grilliot Nicholas P and Grilliot Kimberly E
Home Financials for this Owner
Home Financials are based on the most recent Mortgage that was taken out on this home.
Original Mortgage
$152,605
Interest Rate
6.36%
Mortgage Type
FHA
Purchase Details
Closed on
Aug 18, 2006
Sold by
Buechly Eugene
Bought by
Buechly Eugene and Williams Lori J
Purchase Details
Closed on
Jan 1, 1990
Bought by
Buechly Eugene
Create a Home Valuation Report for This Property
The Home Valuation Report is an in-depth analysis detailing your home's value as well as a comparison with similar homes in the area
Home Values in the Area
Average Home Value in this Area
Purchase History
| Date | Buyer | Sale Price | Title Company |
|---|---|---|---|
| Grilliot Family Revocable Trust | -- | Northwest Title | |
| Ely Rus A | $30,000 | None Available | |
| Grilliot Nicholas P | $155,000 | -- | |
| Buechly Eugene | -- | -- | |
| Buechly Eugene | -- | -- |
Source: Public Records
Mortgage History
| Date | Status | Borrower | Loan Amount |
|---|---|---|---|
| Previous Owner | Buechly Eugene | $152,605 |
Source: Public Records
Tax History Compared to Growth
Tax History
| Year | Tax Paid | Tax Assessment Tax Assessment Total Assessment is a certain percentage of the fair market value that is determined by local assessors to be the total taxable value of land and additions on the property. | Land | Improvement |
|---|---|---|---|---|
| 2024 | $2,617 | $78,020 | $26,810 | $51,210 |
| 2023 | $2,617 | $78,020 | $26,810 | $51,210 |
| 2022 | $2,650 | $78,020 | $26,810 | $51,210 |
| 2021 | $2,183 | $67,660 | $28,280 | $39,380 |
| 2020 | $2,472 | $67,660 | $28,280 | $39,380 |
| 2019 | $2,465 | $67,660 | $28,280 | $39,380 |
| 2018 | $1,946 | $54,400 | $19,360 | $35,040 |
| 2017 | $1,985 | $54,400 | $19,360 | $35,040 |
| 2016 | $1,907 | $54,400 | $19,360 | $35,040 |
| 2015 | $1,808 | $51,310 | $18,270 | $33,040 |
| 2014 | $1,808 | $51,310 | $18,270 | $33,040 |
| 2013 | $1,818 | $51,310 | $18,270 | $33,040 |
Source: Public Records
Map
Nearby Homes
- 1831 Wilshire Dr
- 1821 Wilshire Dr
- 513 Spotted Doe Trail
- 210 Lyndhurst Dr
- 1235 Marwood Dr
- 0 Robert M Davis Pkwy
- 1435 Covington Ave
- 1271 Park Ave
- 215 Levering Dr
- 403 Brentwood Ave
- 3 Lake Ridge Dr
- 1206 Echo Lake Dr
- 8490 Bennett Dr
- 1200 W High St
- 1133 W Water St
- 806 Candlewood Blvd
- 1119 Anderson St
- 817 Washington Ave
- 8500 Mulberry Grove Rakestr Rd
- 9510 Rakestraw Rd
- 9510 Mulberry Grove Rakestr Rd
- 1830 W High St
- 305 Westview Dr
- 311 Westview Dr
- 317 Westview Dr
- 1837 W Parkway Dr
- 1841 W Parkway Dr
- 1833 W Parkway Dr
- 1845 W Parkway Dr
- 323 Westview Dr
- 1829 W Parkway Dr
- 1849 W Parkway Dr
- 1823 W Parkway Dr
- 329 Westview Dr
- 1853 W Parkway Dr
- 1821 W Parkway Dr
- 1857 W Parkway Dr
- 335 Westview Dr