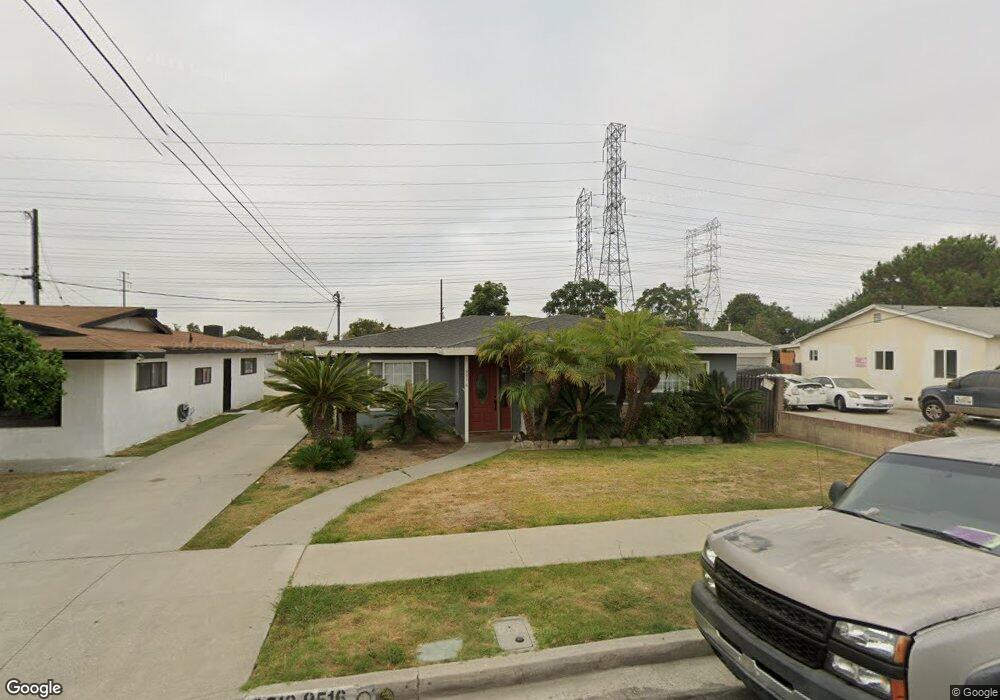
9516 Rose St Bellflower, CA 90706
Estimated Value: $848,000 - $1,275,000
6
Beds
3
Baths
2,634
Sq Ft
$424/Sq Ft
Est. Value
About This Home
This home is located at 9516 Rose St, Bellflower, CA 90706 and is currently estimated at $1,117,318, approximately $424 per square foot. 9516 Rose St is a home located in Los Angeles County with nearby schools including Mayfair High School and St. Bernard School.
Ownership History
Date
Name
Owned For
Owner Type
Purchase Details
Closed on
Aug 4, 1998
Sold by
Long Iron Investments Ltd Partnership
Bought by
Raye Jerry and Raye Nicole M
Current Estimated Value
Home Financials for this Owner
Home Financials are based on the most recent Mortgage that was taken out on this home.
Original Mortgage
$220,525
Interest Rate
6.86%
Mortgage Type
FHA
Purchase Details
Closed on
Jan 15, 1998
Sold by
Stapakis Steven W and Kootsikas Joanne
Bought by
Long Iron Investments Ltd Partnership
Purchase Details
Closed on
Jan 14, 1998
Sold by
Stapakis Steven W
Bought by
Stapakis Steven W and Kootsikas Joanne
Purchase Details
Closed on
Sep 10, 1997
Sold by
Spoolstra Tena and Spoolstra Marcia A
Bought by
The Rose Bellflower Trust
Purchase Details
Closed on
Jan 3, 1997
Sold by
Spoolstra Marcia A
Bought by
Molsbee Leanna Denise
Create a Home Valuation Report for This Property
The Home Valuation Report is an in-depth analysis detailing your home's value as well as a comparison with similar homes in the area
Home Values in the Area
Average Home Value in this Area
Purchase History
| Date | Buyer | Sale Price | Title Company |
|---|---|---|---|
| Raye Jerry | $229,000 | North American Title Co | |
| Long Iron Investments Ltd Partnership | -- | -- | |
| Stapakis Steven W | -- | -- | |
| Stapakis Steven W | -- | -- | |
| The Rose Bellflower Trust | $235,000 | -- | |
| Molsbee Leanna Denise | -- | -- |
Source: Public Records
Mortgage History
| Date | Status | Borrower | Loan Amount |
|---|---|---|---|
| Previous Owner | Raye Jerry | $220,525 |
Source: Public Records
Tax History Compared to Growth
Tax History
| Year | Tax Paid | Tax Assessment Tax Assessment Total Assessment is a certain percentage of the fair market value that is determined by local assessors to be the total taxable value of land and additions on the property. | Land | Improvement |
|---|---|---|---|---|
| 2025 | $4,838 | $358,980 | $167,730 | $191,250 |
| 2024 | $4,838 | $351,942 | $164,442 | $187,500 |
| 2023 | $4,660 | $345,042 | $161,218 | $183,824 |
| 2022 | $4,718 | $338,277 | $158,057 | $180,220 |
| 2021 | $4,886 | $331,645 | $154,958 | $176,687 |
| 2020 | $4,440 | $328,246 | $153,370 | $174,876 |
| 2019 | $4,368 | $321,811 | $150,363 | $171,448 |
| 2018 | $4,110 | $315,502 | $147,415 | $168,087 |
| 2016 | $3,927 | $303,253 | $141,692 | $161,561 |
| 2015 | $3,849 | $298,699 | $139,564 | $159,135 |
| 2014 | $3,807 | $292,849 | $136,831 | $156,018 |
Source: Public Records
Map
Nearby Homes
- 9513 Cedar St
- 5134 Ashworth St
- 9713 Cedar St
- 9253 Rose St
- 6118 Amos Ave
- 6127 Adenmoor Ave
- 5549 Ashworth St
- 6023 Whitewood Ave
- 17458 Deerfield Ave
- 6107 Faculty Ave
- 6168 Briercrest Ave
- 9112 Cedar St
- 9924 Cedar St
- 9133 Ramona St Unit 2
- 4814 Hedda St
- 9928 Cedar St
- 9235 Artesia Blvd Unit 5
- 5817 Fidler Ave
- 9833 Palm St
- 17820 Lakewood Blvd Unit 30