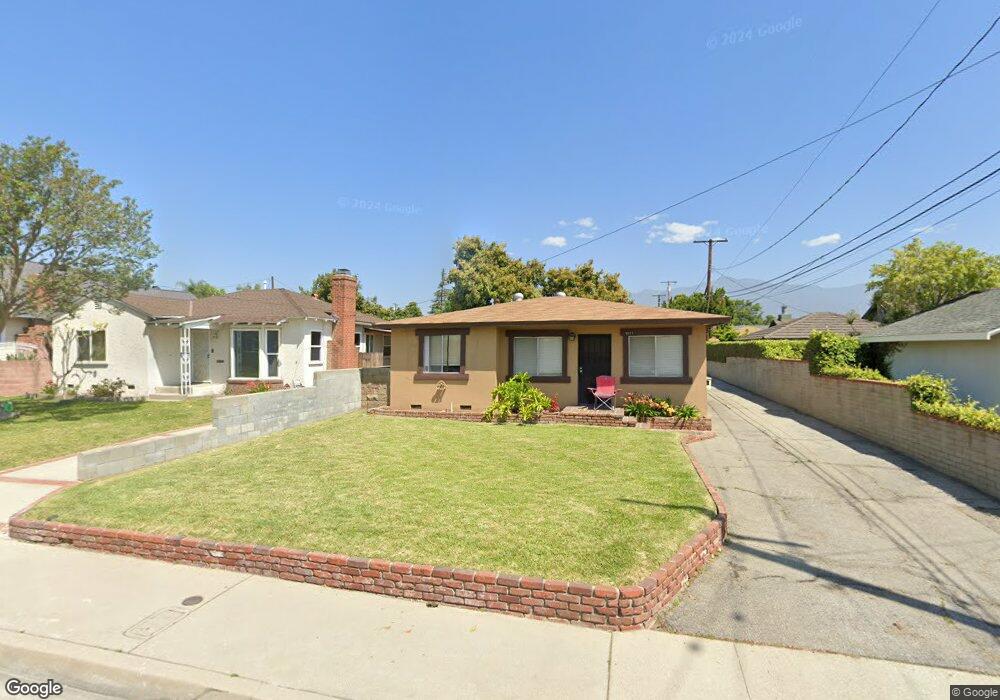
9517 Garibaldi Ave Temple City, CA 91780
Estimated Value: $1,796,000 - $2,748,000
7
Beds
5
Baths
4,484
Sq Ft
$531/Sq Ft
Est. Value
About This Home
This home is located at 9517 Garibaldi Ave, Temple City, CA 91780 and is currently estimated at $2,380,606, approximately $530 per square foot. 9517 Garibaldi Ave is a home located in Los Angeles County with nearby schools including Longden Elementary School, Oak Avenue Intermediate School, and Temple City High School.
Ownership History
Date
Name
Owned For
Owner Type
Purchase Details
Closed on
May 17, 2004
Sold by
Yeh Philip J
Bought by
Yeh Gilbert C and Yeh Helen A
Current Estimated Value
Home Financials for this Owner
Home Financials are based on the most recent Mortgage that was taken out on this home.
Original Mortgage
$424,000
Outstanding Balance
$202,565
Interest Rate
5.77%
Mortgage Type
New Conventional
Estimated Equity
$2,178,041
Purchase Details
Closed on
Feb 20, 2001
Sold by
Judo Febriani S and Judo Family Trust
Bought by
Yeh Gilbert C and Yeh Helen A
Home Financials for this Owner
Home Financials are based on the most recent Mortgage that was taken out on this home.
Original Mortgage
$450,000
Interest Rate
6.98%
Purchase Details
Closed on
Apr 4, 1994
Sold by
Judo Febriani S
Bought by
Judo Febriani S
Create a Home Valuation Report for This Property
The Home Valuation Report is an in-depth analysis detailing your home's value as well as a comparison with similar homes in the area
Home Values in the Area
Average Home Value in this Area
Purchase History
| Date | Buyer | Sale Price | Title Company |
|---|---|---|---|
| Yeh Gilbert C | -- | Chicago Title Co | |
| Yeh Gilbert C | $650,000 | Equity Title | |
| Judo Febriani S | -- | -- |
Source: Public Records
Mortgage History
| Date | Status | Borrower | Loan Amount |
|---|---|---|---|
| Open | Yeh Gilbert C | $424,000 | |
| Previous Owner | Yeh Gilbert C | $450,000 | |
| Closed | Yeh Gilbert C | $20,000 |
Source: Public Records
Tax History Compared to Growth
Tax History
| Year | Tax Paid | Tax Assessment Tax Assessment Total Assessment is a certain percentage of the fair market value that is determined by local assessors to be the total taxable value of land and additions on the property. | Land | Improvement |
|---|---|---|---|---|
| 2025 | $12,067 | $979,430 | $479,169 | $500,261 |
| 2024 | $12,067 | $960,226 | $469,774 | $490,452 |
| 2023 | $11,805 | $941,399 | $460,563 | $480,836 |
| 2022 | $11,075 | $922,941 | $451,533 | $471,408 |
| 2021 | $11,251 | $904,845 | $442,680 | $462,165 |
| 2020 | $11,098 | $895,568 | $438,141 | $457,427 |
| 2019 | $10,861 | $878,008 | $429,550 | $448,458 |
| 2018 | $10,356 | $860,793 | $421,128 | $439,665 |
| 2016 | $9,897 | $827,370 | $404,776 | $422,594 |
| 2015 | $9,733 | $814,943 | $398,696 | $416,247 |
| 2014 | $9,600 | $798,981 | $390,887 | $408,094 |
Source: Public Records
Map
Nearby Homes
- 6119 Temple City Blvd
- 6204 Oak Ave
- 6037 Oak Ave
- 5929 Oak Ave
- 9711 Garibaldi Ave
- 9665 Longden Ave
- 6227 Sultana Ave
- 6433 Livia Ave
- 9138 Emperor Ave
- 6137 Rosemead Blvd
- 6159 Rosemead Blvd
- 6022 Rowland Ave
- 0 Sultana Ave
- 5823 Myda Ave
- 5635 Noel Dr
- 9618 E Camino Real Ave
- 5530 Alessandro Ave
- 9861 E Lemon Ave
- 5819 Baldwin Ave Unit C
- 639 W Longden Ave
- 6115 Primrose Ave
- 9507 Garibaldi Ave
- 6121 Primrose Ave
- 9513 Garibaldi Ave
- 6109 Primrose Ave
- 9505 Garibaldi Ave
- 6127 Primrose Ave
- 9503 Garibaldi Ave
- 9503 1/2 Garibaldi Ave
- 6105 Primrose Ave
- 9524 Flaherty St
- 9534 Flaherty St
- 9441 Garibaldi Ave
- 9503 3/4 Garibaldi Ave
- 9518 Flaherty St
- 9540 Flaherty St
- 9512 Flaherty St
- 6118 Primrose Ave
- 6114 Primrose Ave