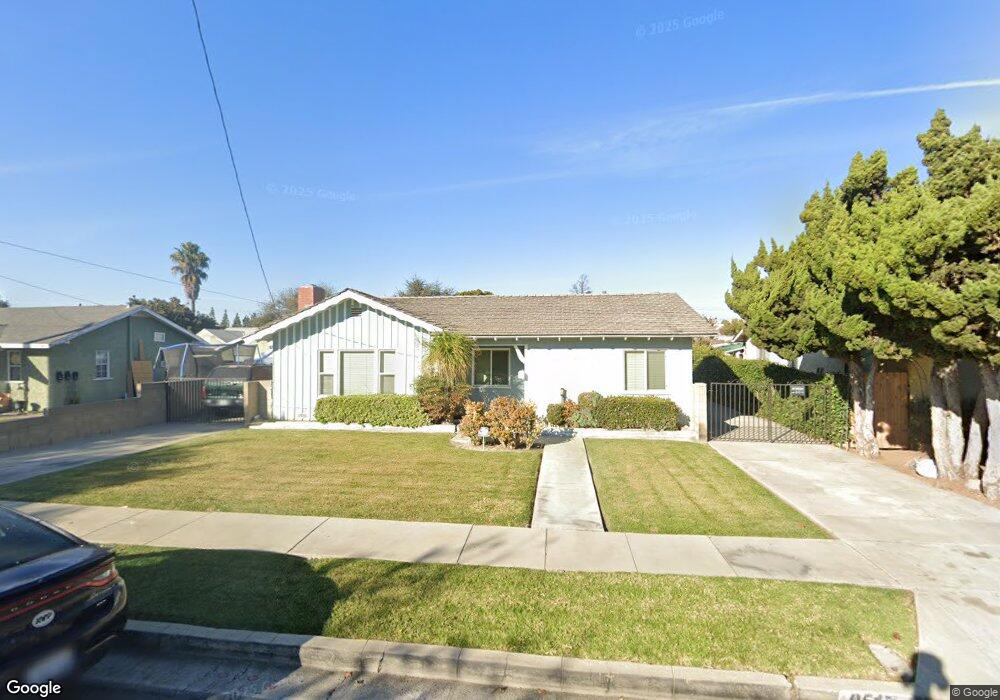
9517 Walnut St Bellflower, CA 90706
Estimated Value: $665,000 - $862,000
1
Bed
1
Bath
1,239
Sq Ft
$619/Sq Ft
Est. Value
About This Home
This home is located at 9517 Walnut St, Bellflower, CA 90706 and is currently estimated at $766,586, approximately $618 per square foot. 9517 Walnut St is a home located in Los Angeles County with nearby schools including Ramona Elementary School, Bellflower High School, and St. Bernard School.
Ownership History
Date
Name
Owned For
Owner Type
Purchase Details
Closed on
Jul 14, 2012
Sold by
Naqvi Syed Q A
Bought by
Naqvi Saira Zaida
Current Estimated Value
Purchase Details
Closed on
Mar 29, 2011
Sold by
Urias Edith
Bought by
Naqvi Syed Q A
Purchase Details
Closed on
Oct 19, 2009
Sold by
Naqvi Syed Q A
Bought by
Urias Edith and Urias Carlos
Purchase Details
Closed on
Aug 16, 2001
Sold by
Rodriguez Saribel E
Bought by
Naqvi Syed Q A
Purchase Details
Closed on
Apr 9, 1999
Sold by
Washington Mutual Bank Fa
Bought by
Rodriguez Saribel
Home Financials for this Owner
Home Financials are based on the most recent Mortgage that was taken out on this home.
Original Mortgage
$159,920
Interest Rate
6.98%
Mortgage Type
Stand Alone First
Purchase Details
Closed on
Dec 31, 1998
Sold by
Javellana Dennis
Bought by
Washington Mutual Bank Fa
Create a Home Valuation Report for This Property
The Home Valuation Report is an in-depth analysis detailing your home's value as well as a comparison with similar homes in the area
Home Values in the Area
Average Home Value in this Area
Purchase History
| Date | Buyer | Sale Price | Title Company |
|---|---|---|---|
| Naqvi Saira Zaida | -- | None Available | |
| Naqvi Syed Q A | -- | None Available | |
| Urias Edith | -- | None Available | |
| Naqvi Syed Q A | -- | -- | |
| Rodriguez Saribel | $200,000 | Chicago Title Co | |
| Washington Mutual Bank Fa | $110,541 | -- |
Source: Public Records
Mortgage History
| Date | Status | Borrower | Loan Amount |
|---|---|---|---|
| Previous Owner | Rodriguez Saribel | $159,920 | |
| Closed | Rodriguez Saribel | $29,985 |
Source: Public Records
Tax History
| Year | Tax Paid | Tax Assessment Tax Assessment Total Assessment is a certain percentage of the fair market value that is determined by local assessors to be the total taxable value of land and additions on the property. | Land | Improvement |
|---|---|---|---|---|
| 2025 | $3,889 | $295,435 | $217,150 | $78,285 |
| 2024 | $3,889 | $289,643 | $212,893 | $76,750 |
| 2023 | $3,743 | $283,965 | $208,719 | $75,246 |
| 2022 | $3,676 | $278,398 | $204,627 | $73,771 |
| 2021 | $3,601 | $272,940 | $200,615 | $72,325 |
| 2019 | $3,511 | $264,846 | $194,665 | $70,181 |
| 2018 | $3,295 | $259,654 | $190,849 | $68,805 |
| 2016 | $3,158 | $249,573 | $183,439 | $66,134 |
| 2015 | $3,094 | $245,825 | $180,684 | $65,141 |
| 2014 | $3,057 | $241,010 | $177,145 | $63,865 |
Source: Public Records
Map
Nearby Homes
- 16919 Ardmore Ave
- 9559 Flower St
- 16822 Ardmore Ave
- 17046 Clark Ave
- 9520 Mayne St
- 9601 Mayne St
- 16401 Clark Ave
- 16713 Virginia Ave
- 9929 Park St
- 17100 Apple Ave
- 9921 Flora Vista St Unit 5
- 9921 Flora Vista St Unit 6
- 9548 Alondra Blvd
- 9235 Artesia Blvd Unit 5
- 9200 Palm St Unit 6
- 15751 Blaine Ave
- 9339 Alondra Blvd Unit 2
- 16331 Cornuta Ave Unit F
- 16414 Cornuta Ave Unit 8
- 17458 Deerfield Ave
Your Personal Tour Guide
Ask me questions while you tour the home.