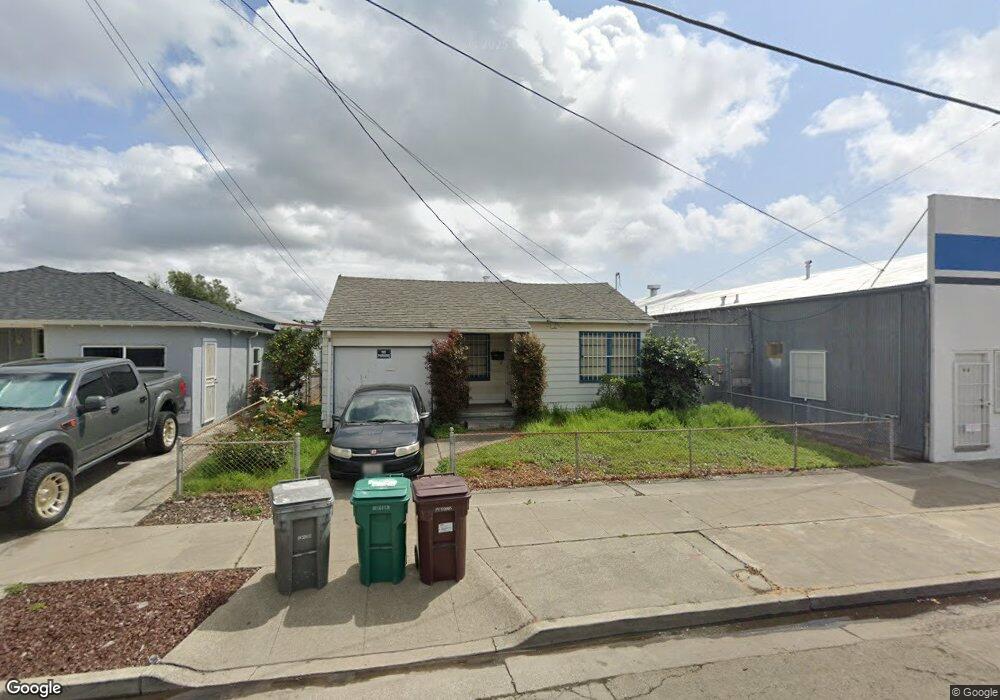
952 88th Ave Oakland, CA 94621
Highland NeighborhoodEstimated Value: $364,000 - $395,000
2
Beds
1
Bath
841
Sq Ft
$457/Sq Ft
Est. Value
About This Home
This home is located at 952 88th Ave, Oakland, CA 94621 and is currently estimated at $384,465, approximately $457 per square foot. 952 88th Ave is a home located in Alameda County with nearby schools including New Highland Academy, Acorn Woodland Elementary School, and Encompass Academy Elementary.
Ownership History
Date
Name
Owned For
Owner Type
Purchase Details
Closed on
Aug 11, 2006
Sold by
Cotrell Joyce Ann
Bought by
Jackson Christopher
Current Estimated Value
Purchase Details
Closed on
Feb 18, 2006
Sold by
The Elsie & Loretta Lightfoot Family Tru
Bought by
Cotrell Joyce Ann
Purchase Details
Closed on
Feb 10, 2004
Sold by
Aalto Investment & Development Co Inc
Bought by
Ai & D Llc
Purchase Details
Closed on
Oct 21, 2003
Sold by
Aalto Investment & Development Co Inc
Bought by
Ai & D Llc
Create a Home Valuation Report for This Property
The Home Valuation Report is an in-depth analysis detailing your home's value as well as a comparison with similar homes in the area
Home Values in the Area
Average Home Value in this Area
Purchase History
| Date | Buyer | Sale Price | Title Company |
|---|---|---|---|
| Jackson Christopher | -- | None Available | |
| Cotrell Joyce Ann | -- | None Available | |
| Ai & D Llc | -- | None Available | |
| Aalto Investment & Development Co Inc | -- | -- | |
| Ai & D Llc | -- | -- |
Source: Public Records
Tax History
| Year | Tax Paid | Tax Assessment Tax Assessment Total Assessment is a certain percentage of the fair market value that is determined by local assessors to be the total taxable value of land and additions on the property. | Land | Improvement |
|---|---|---|---|---|
| 2025 | $2,937 | $81,428 | $48,857 | $32,571 |
| 2024 | $2,937 | $79,832 | $47,899 | $31,933 |
| 2023 | $2,948 | $78,267 | $46,960 | $31,307 |
| 2022 | $2,794 | $76,733 | $46,040 | $30,693 |
| 2021 | $2,517 | $75,228 | $45,137 | $30,091 |
| 2020 | $2,486 | $74,457 | $44,674 | $29,783 |
| 2019 | $2,295 | $72,998 | $43,799 | $29,199 |
| 2018 | $2,248 | $71,567 | $42,940 | $28,627 |
| 2017 | $2,126 | $70,163 | $42,098 | $28,065 |
| 2016 | $1,962 | $68,788 | $41,273 | $27,515 |
| 2015 | $1,945 | $67,755 | $40,653 | $27,102 |
| 2014 | $1,801 | $66,428 | $39,857 | $26,571 |
Source: Public Records
Map
Nearby Homes
Your Personal Tour Guide
Ask me questions while you tour the home.