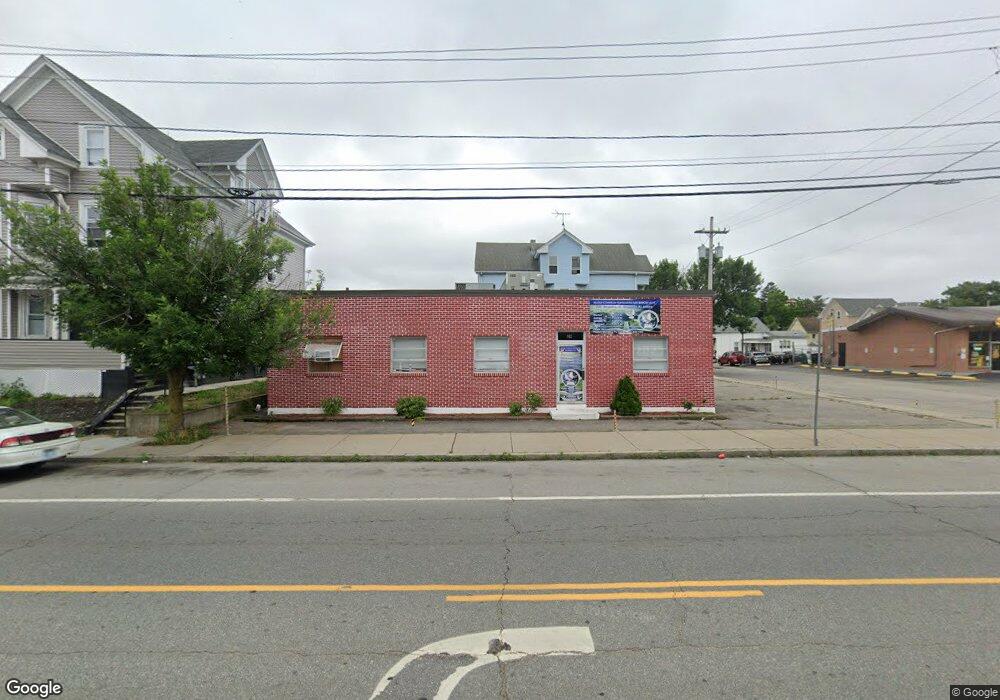
952 Cranston St Cranston, RI 02920
Arlington NeighborhoodEstimated Value: $603,668
--
Bed
4
Baths
3,000
Sq Ft
$201/Sq Ft
Est. Value
About This Home
This home is located at 952 Cranston St, Cranston, RI 02920 and is currently estimated at $603,668, approximately $201 per square foot. 952 Cranston St is a home located in Providence County with nearby schools including Hugh B. Bain Middle School, Cranston High School East, and Achievement First Iluminar Mayoral Academy.
Ownership History
Date
Name
Owned For
Owner Type
Purchase Details
Closed on
Mar 19, 2014
Sold by
Rampost Associates Llc
Bought by
Dimas Realty Llc
Current Estimated Value
Home Financials for this Owner
Home Financials are based on the most recent Mortgage that was taken out on this home.
Original Mortgage
$199,900
Outstanding Balance
$150,998
Interest Rate
4.25%
Mortgage Type
Commercial
Estimated Equity
$452,670
Purchase Details
Closed on
May 29, 2013
Sold by
First Cranston Assoc L
Bought by
Rampost Assoc Llc
Purchase Details
Closed on
Dec 8, 2008
Sold by
Milo Holdings Llc
Bought by
Salamone Francesco
Purchase Details
Closed on
Mar 30, 2007
Sold by
Bazar Manufacturing
Bought by
Milo Holdings
Create a Home Valuation Report for This Property
The Home Valuation Report is an in-depth analysis detailing your home's value as well as a comparison with similar homes in the area
Home Values in the Area
Average Home Value in this Area
Purchase History
| Date | Buyer | Sale Price | Title Company |
|---|---|---|---|
| Dimas Realty Llc | $219,900 | -- | |
| Rampost Associates Llc | -- | -- | |
| Rampost Associates Llc | -- | -- | |
| Rampost Assoc Llc | -- | -- | |
| Salamone Francesco | $121,000 | -- | |
| Milo Holdings | $325,000 | -- |
Source: Public Records
Mortgage History
| Date | Status | Borrower | Loan Amount |
|---|---|---|---|
| Open | Milo Holdings | $199,900 |
Source: Public Records
Tax History Compared to Growth
Tax History
| Year | Tax Paid | Tax Assessment Tax Assessment Total Assessment is a certain percentage of the fair market value that is determined by local assessors to be the total taxable value of land and additions on the property. | Land | Improvement |
|---|---|---|---|---|
| 2024 | $8,895 | $435,600 | $81,600 | $354,000 |
| 2023 | $7,592 | $267,800 | $69,700 | $198,100 |
| 2022 | $7,437 | $267,800 | $69,700 | $198,100 |
| 2021 | $7,231 | $267,800 | $69,700 | $198,100 |
| 2020 | $7,681 | $246,500 | $58,600 | $187,900 |
| 2019 | $7,681 | $246,500 | $58,600 | $187,900 |
| 2018 | $7,503 | $246,500 | $58,600 | $187,900 |
| 2017 | $7,250 | $210,700 | $53,000 | $157,700 |
| 2016 | $7,096 | $210,700 | $53,000 | $157,700 |
| 2015 | $7,096 | $210,700 | $53,000 | $157,700 |
| 2014 | $8,473 | $247,400 | $87,100 | $160,300 |
Source: Public Records
Map
Nearby Homes