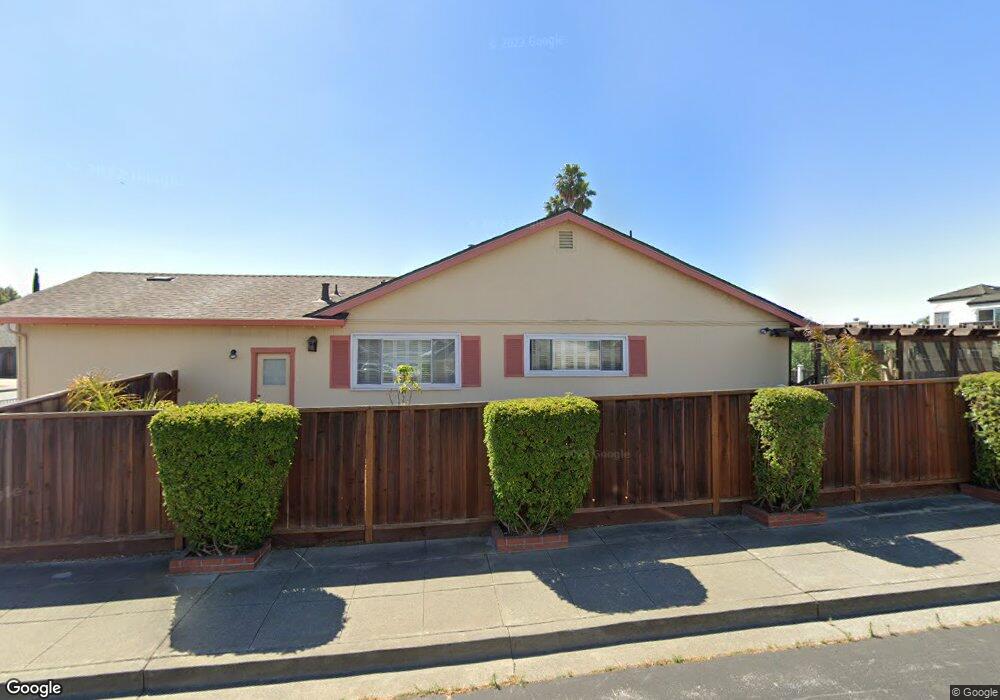
952 Flying Fish St Foster City, CA 94404
Bay Vista NeighborhoodEstimated Value: $1,960,000 - $2,191,000
2
Beds
2
Baths
1,790
Sq Ft
$1,173/Sq Ft
Est. Value
About This Home
This home is located at 952 Flying Fish St, Foster City, CA 94404 and is currently estimated at $2,100,530, approximately $1,173 per square foot. 952 Flying Fish St is a home located in San Mateo County with nearby schools including Audubon Elementary School, Bowditch Middle School, and San Mateo High School.
Ownership History
Date
Name
Owned For
Owner Type
Purchase Details
Closed on
Mar 2, 1998
Sold by
Foster Richard H
Bought by
Franceschi Peter J
Current Estimated Value
Home Financials for this Owner
Home Financials are based on the most recent Mortgage that was taken out on this home.
Original Mortgage
$313,000
Outstanding Balance
$57,108
Interest Rate
6.99%
Estimated Equity
$2,043,422
Create a Home Valuation Report for This Property
The Home Valuation Report is an in-depth analysis detailing your home's value as well as a comparison with similar homes in the area
Home Values in the Area
Average Home Value in this Area
Purchase History
| Date | Buyer | Sale Price | Title Company |
|---|---|---|---|
| Franceschi Peter J | $166,000 | Old Republic Title Ins Compa |
Source: Public Records
Mortgage History
| Date | Status | Borrower | Loan Amount |
|---|---|---|---|
| Open | Franceschi Peter J | $313,000 |
Source: Public Records
Tax History Compared to Growth
Tax History
| Year | Tax Paid | Tax Assessment Tax Assessment Total Assessment is a certain percentage of the fair market value that is determined by local assessors to be the total taxable value of land and additions on the property. | Land | Improvement |
|---|---|---|---|---|
| 2025 | $6,329 | $565,333 | $191,394 | $373,939 |
| 2023 | $6,329 | $543,383 | $183,963 | $359,420 |
| 2022 | $6,122 | $532,729 | $180,356 | $352,373 |
| 2021 | $6,047 | $522,285 | $176,820 | $345,465 |
| 2020 | $5,879 | $516,930 | $175,007 | $341,923 |
| 2019 | $5,565 | $506,796 | $171,576 | $335,220 |
| 2018 | $5,466 | $496,860 | $168,212 | $328,648 |
| 2017 | $5,405 | $487,119 | $164,914 | $322,205 |
| 2016 | $5,285 | $477,570 | $161,681 | $315,889 |
| 2015 | $5,051 | $460,398 | $159,253 | $301,145 |
| 2014 | $4,575 | $420,007 | $156,134 | $263,873 |
Source: Public Records
Map
Nearby Homes
- 224 Loon Ct
- 1074 Eagle Ln
- 1351 Marlin Ave
- 1336 Marlin Ave
- 748 Gull Ave
- 275 Puffin Ct
- 650 Pilgrim Dr
- 241 Bonita Ln
- 3206 Admiralty Ln
- 1102 Admiralty Ln
- 591 Pilgrim Dr
- 708 Thayer Ln Unit 404
- 769 Eppleton Ln Unit 302
- 1028 Foster Square Ln Unit 305
- 708 Eppleton Ln Unit 204
- 718 Eppleton Ln Unit 303
- 370 Bramble Ct
- 926 Lido Ln
- 1018 Lido Ln
- 1131 Compass Ln Unit 108
- 954 Flying Fish St
- 958 Flying Fish St
- 948 Flying Fish St
- 248 Shearwater Isle
- 244 Shearwater Isle
- 951 Flying Fish St
- 953 Flying Fish St
- 240 Shearwater Isle Unit 2
- 240 Shearwater Isle
- 962 Flying Fish St
- 252 Shearwater Isle
- 944 Flying Fish St
- 957 Flying Fish St
- 949 Flying Fish St
- 236 Shearwater Isle
- 256 Shearwater Isle
- 961 Flying Fish St
- 964 Flying Fish St
- 945 Flying Fish St
- 940 Flying Fish St