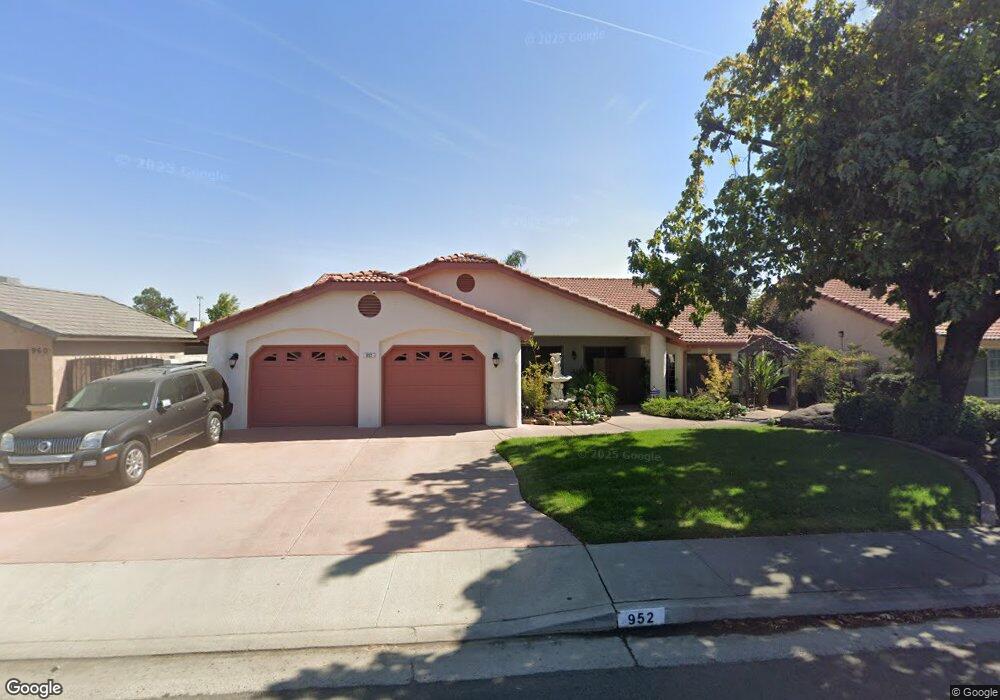
952 Kala Loop Mc Farland, CA 93250
Estimated Value: $380,000 - $433,000
4
Beds
3
Baths
2,322
Sq Ft
$177/Sq Ft
Est. Value
About This Home
This home is located at 952 Kala Loop, Mc Farland, CA 93250 and is currently estimated at $410,339, approximately $176 per square foot. 952 Kala Loop is a home located in Kern County with nearby schools including McFarland High School.
Create a Home Valuation Report for This Property
The Home Valuation Report is an in-depth analysis detailing your home's value as well as a comparison with similar homes in the area
Home Values in the Area
Average Home Value in this Area
Tax History
| Year | Tax Paid | Tax Assessment Tax Assessment Total Assessment is a certain percentage of the fair market value that is determined by local assessors to be the total taxable value of land and additions on the property. | Land | Improvement |
|---|---|---|---|---|
| 2025 | $3,131 | $266,089 | $31,190 | $234,899 |
| 2024 | $3,084 | $260,873 | $30,579 | $230,294 |
| 2023 | $3,084 | $255,759 | $29,980 | $225,779 |
| 2022 | $3,013 | $250,745 | $29,393 | $221,352 |
| 2021 | $2,924 | $245,829 | $28,817 | $217,012 |
| 2020 | $2,845 | $243,309 | $28,522 | $214,787 |
| 2019 | $2,678 | $243,309 | $28,522 | $214,787 |
| 2018 | $2,643 | $233,863 | $27,415 | $206,448 |
| 2017 | $2,573 | $229,278 | $26,878 | $202,400 |
| 2016 | $2,537 | $224,783 | $26,351 | $198,432 |
| 2015 | $2,489 | $221,408 | $25,956 | $195,452 |
| 2014 | $2,379 | $217,072 | $25,448 | $191,624 |
Source: Public Records
Map
Nearby Homes
- 830 Davis Ave
- 733 Ensenata Dr
- 617 7th St
- 249 Robertson Ave
- 749 Browning Rd
- 0 W Sherwood Ave Unit 202506495
- 0 W Sherwood Ave Unit 21453658
- 314 8th St
- 276 San Juan St
- 124 4th Place
- 216 Browning Rd
- 148 San Lucas St
- 254 E Sherwood Ave
- 0 E Sherwood Ave
- 737 Misty Ave
- 737 Concord Ct
- 13271 Garzoli Ave
- 30787 Perkins Ave
- 799 Moscato St
- 583 Taylor Ave
Your Personal Tour Guide
Ask me questions while you tour the home.