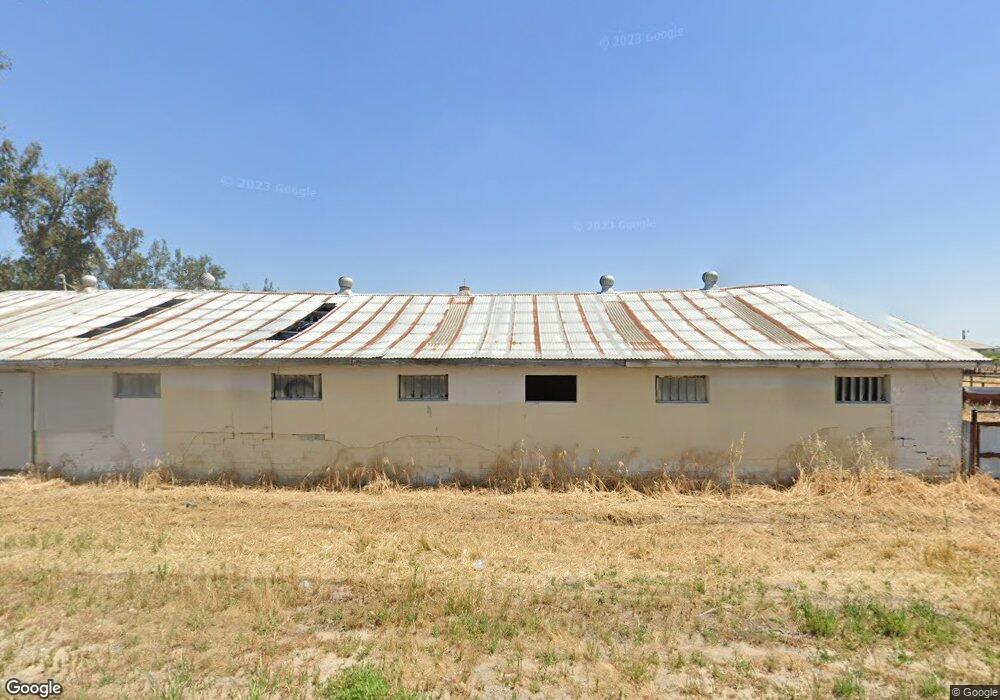
9524 Crows Landing Rd Crows Landing, CA 95313
Estimated Value: $804,000 - $1,350,770
3
Beds
2
Baths
2,015
Sq Ft
$535/Sq Ft
Est. Value
About This Home
This home is located at 9524 Crows Landing Rd, Crows Landing, CA 95313 and is currently estimated at $1,077,385, approximately $534 per square foot. 9524 Crows Landing Rd is a home located in Stanislaus County with nearby schools including Chatom Elementary School, Mountain View Middle School, and Turlock Junior High School.
Ownership History
Date
Name
Owned For
Owner Type
Purchase Details
Closed on
Jun 11, 2025
Sold by
Plaa 2001 Trust and Plaa Michel J
Bought by
Plaa 2001 Trust and Plaa
Current Estimated Value
Purchase Details
Closed on
Mar 27, 2025
Sold by
Plaa 2001 Trust and Plaa Michel J
Bought by
Plaa 2001 Trust and Plaa
Purchase Details
Closed on
Dec 23, 2024
Sold by
El Katrina Family Partnership Lp
Bought by
Plaa 2001 Trust and Plaa
Purchase Details
Closed on
Feb 6, 2017
Sold by
Alvernaz Joann
Bought by
Plaa Michel and Plaa Tami
Purchase Details
Closed on
Jun 12, 2015
Sold by
Dick Karen D
Bought by
M & J Alvernaz 1998 Trust
Home Financials for this Owner
Home Financials are based on the most recent Mortgage that was taken out on this home.
Original Mortgage
$1,200,000
Interest Rate
3.64%
Mortgage Type
Seller Take Back
Purchase Details
Closed on
Mar 7, 2003
Sold by
Alvernaz Jo Ann D and Santos Kathleen A
Bought by
Dick Karen D
Create a Home Valuation Report for This Property
The Home Valuation Report is an in-depth analysis detailing your home's value as well as a comparison with similar homes in the area
Purchase History
| Date | Buyer | Sale Price | Title Company |
|---|---|---|---|
| Plaa 2001 Trust | -- | None Listed On Document | |
| Plaa 2001 Trust | -- | Cypress Title | |
| Plaa 2001 Trust | -- | None Listed On Document | |
| El Katrina Family Partnership Lp | -- | None Listed On Document | |
| Plaa Michel | -- | None Available | |
| M & J Alvernaz 1998 Trust | $1,800,000 | First American Title Company | |
| Dick Karen D | -- | -- |
Source: Public Records
Mortgage History
| Date | Status | Borrower | Loan Amount |
|---|---|---|---|
| Previous Owner | M & J Alvernaz 1998 Trust | $1,200,000 |
Source: Public Records
Tax History
| Year | Tax Paid | Tax Assessment Tax Assessment Total Assessment is a certain percentage of the fair market value that is determined by local assessors to be the total taxable value of land and additions on the property. | Land | Improvement |
|---|---|---|---|---|
| 2025 | $10,279 | $802,871 | $544,480 | $258,391 |
| 2024 | $10,448 | $829,144 | $575,819 | $253,325 |
| 2023 | $10,659 | $836,066 | $587,708 | $248,358 |
| 2022 | $10,549 | $824,271 | $580,782 | $243,489 |
| 2021 | $10,213 | $791,114 | $552,399 | $238,715 |
| 2020 | $9,884 | $762,576 | $526,308 | $236,268 |
| 2019 | $9,574 | $732,205 | $500,569 | $231,636 |
| 2018 | $8,704 | $635,552 | $408,457 | $227,095 |
| 2017 | $8,064 | $585,100 | $362,457 | $222,643 |
| 2016 | $7,732 | $565,737 | $347,459 | $218,278 |
| 2015 | $6,498 | $577,754 | $199,423 | $378,331 |
| 2014 | $6,381 | $566,389 | $195,517 | $370,872 |
Source: Public Records
Map
Nearby Homes
- 8631 Mitchell Rd
- 1237 W Keyes Rd
- 5237 Crows Landing Rd
- 13807 Carpenter Rd
- 16642 Hickory Ave
- 2030 E Grayson Rd Unit 42
- 2030 E Grayson Rd Unit 44
- 2030 E Grayson Rd Unit 26
- 2030 E Grayson Rd Unit 41
- 1736 S Washington Rd
- 4701 S Faith Home Rd
- 4012 W Tuolumne Rd
- 6630 Foote Rd
- 4207 W Linwood Ave
- 4396 Admiral Ct
- 4376 Admiral Ct
- 1279 Montclaire Dr
- 4013 W Tuolumne Rd
- 3718 W Tuolumne Rd
- 306 Fransil Ln
- 9642 Crows Landing Rd
- 407 Bystrum Rd
- 9900 Crows Landing Rd
- 306 Bystrum Rd
- 9912 Crows Landing Rd
- 12407 W Main St
- 12419 W Main St
- 12425 W Main St
- 9372 Crows Landing Rd
- 1030 Bystrum Rd
- 12125 W Main St
- 1107 Bystrum Rd
- 9907 Crows Landing Rd
- 9942 Crows Landing Rd
- 12300 W Main St
- 12636 W Main Ave
- 12241 W Main St
- 107 W Main Ave
- 9224 Crows Landing Rd
- 9579 Crows Landing Rd
Your Personal Tour Guide
Ask me questions while you tour the home.