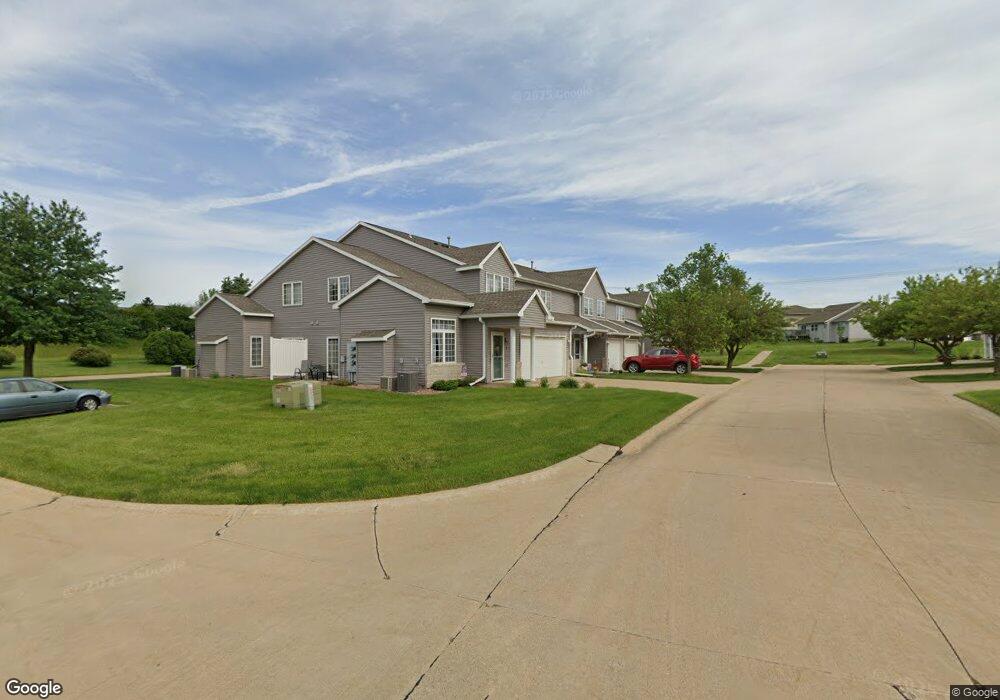
953 74th St NE Cedar Rapids, IA 52402
Estimated Value: $156,000 - $164,000
2
Beds
1
Bath
1,241
Sq Ft
$128/Sq Ft
Est. Value
About This Home
This home is located at 953 74th St NE, Cedar Rapids, IA 52402 and is currently estimated at $158,965, approximately $128 per square foot. 953 74th St NE is a home located in Linn County with nearby schools including Westfield Elementary School, Oak Ridge School, and Linn-Mar High School.
Ownership History
Date
Name
Owned For
Owner Type
Purchase Details
Closed on
May 11, 2017
Sold by
Farmers State Bank
Bought by
Hayes Sarah A
Current Estimated Value
Home Financials for this Owner
Home Financials are based on the most recent Mortgage that was taken out on this home.
Original Mortgage
$92,150
Outstanding Balance
$76,117
Interest Rate
4.03%
Mortgage Type
New Conventional
Estimated Equity
$82,848
Purchase Details
Closed on
Oct 19, 2012
Sold by
Edwards William L
Bought by
Edwards William L and The William L Edwards Revocable Trust
Purchase Details
Closed on
Nov 28, 2007
Sold by
Edwards William L
Bought by
Edwards William L and William L & Hazel M Edwards Revocable Tr
Purchase Details
Closed on
Aug 10, 2001
Sold by
Heald Julie A
Bought by
Hembroff Thelma J
Home Financials for this Owner
Home Financials are based on the most recent Mortgage that was taken out on this home.
Original Mortgage
$87,975
Interest Rate
7.15%
Mortgage Type
FHA
Create a Home Valuation Report for This Property
The Home Valuation Report is an in-depth analysis detailing your home's value as well as a comparison with similar homes in the area
Home Values in the Area
Average Home Value in this Area
Purchase History
| Date | Buyer | Sale Price | Title Company |
|---|---|---|---|
| Hayes Sarah A | -- | None Available | |
| Edwards William L | -- | None Available | |
| Edwards William L | -- | None Available | |
| Hembroff Thelma J | $89,500 | -- |
Source: Public Records
Mortgage History
| Date | Status | Borrower | Loan Amount |
|---|---|---|---|
| Open | Hayes Sarah A | $92,150 | |
| Previous Owner | Hembroff Thelma J | $87,975 |
Source: Public Records
Tax History Compared to Growth
Tax History
| Year | Tax Paid | Tax Assessment Tax Assessment Total Assessment is a certain percentage of the fair market value that is determined by local assessors to be the total taxable value of land and additions on the property. | Land | Improvement |
|---|---|---|---|---|
| 2025 | $2,724 | $152,700 | $20,500 | $132,200 |
| 2024 | $2,936 | $149,500 | $20,500 | $129,000 |
| 2023 | $2,936 | $149,500 | $20,500 | $129,000 |
| 2022 | $2,842 | $137,300 | $20,500 | $116,800 |
| 2021 | $2,556 | $137,300 | $20,500 | $116,800 |
| 2020 | $2,556 | $117,500 | $16,000 | $101,500 |
| 2019 | $2,390 | $111,400 | $16,000 | $95,400 |
| 2018 | $2,302 | $111,400 | $16,000 | $95,400 |
| 2017 | $2,296 | $112,000 | $9,000 | $103,000 |
| 2016 | $2,285 | $105,500 | $9,000 | $96,500 |
| 2015 | $2,255 | $104,007 | $9,000 | $95,007 |
| 2014 | $2,060 | $104,007 | $9,000 | $95,007 |
| 2013 | $1,984 | $104,007 | $9,000 | $95,007 |
Source: Public Records
Map
Nearby Homes
- 935 74th St NE Unit 1
- 1055 74th St NE Unit 1055
- 7104 Doubletree Rd NE
- 803 73rd St NE
- 7502 Summerset Ave NE
- 1229 Honey Creek Way NE
- 7599 Summerset Ave NE
- 1241 74th St NE Unit 1241
- 7701 Westfield Dr NE
- 1027 Acacia Dr NE
- 6965 Doubletree Rd NE Unit 6965
- 1008 Doubletree Ct NE Unit 1008
- 7128 Summerland Ridge Rd NE
- 7415 Pin Tail Dr NE
- 1226 Prairieview Dr NE
- 1215 Prairieview Dr NE
- 1127 Tiara Dr NE
- 8139 Turtlerun Dr NE
- 929 Messina Dr NE
- 923 Messina Dr NE
- 953 74th St NE Unit A7
- 953 74th St NE Unit A6
- 953 74th St NE
- 953 74th St NE
- 953 74th St NE
- 953 74th St NE
- 953 74th St NE Unit A8
- 953 74th St NE Unit 6
- 953 74th St NE Unit 7
- 953 74th St NE Unit 1
- 953 74th St NE Unit 5
- 953 74th St NE Unit 2
- 925 74th St NE
- 925 74th St NE
- 925 74th St NE Unit B5
- 925 74th St NE Unit B4
- 925 74th St NE Unit B3
- 925 74th St NE Unit B2
- 925 74th St NE Unit B1
- 925 74th St NE Unit B8