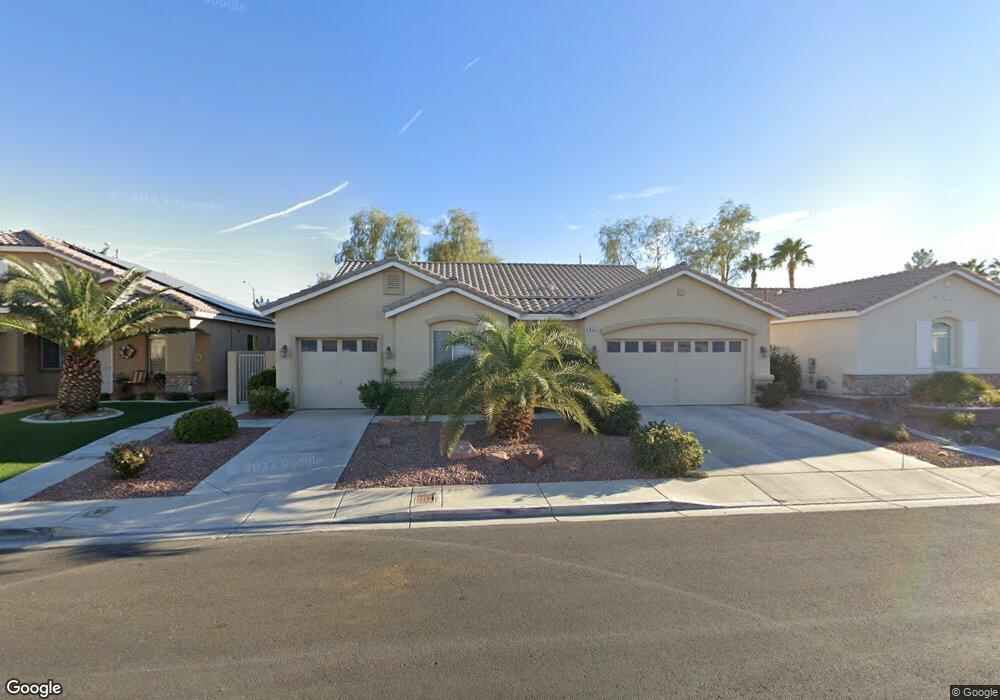
953 Coldwater Falls Way Las Vegas, NV 89123
Silverado Ranch NeighborhoodEstimated Value: $558,954 - $610,000
4
Beds
3
Baths
2,257
Sq Ft
$259/Sq Ft
Est. Value
About This Home
This home is located at 953 Coldwater Falls Way, Las Vegas, NV 89123 and is currently estimated at $583,739, approximately $258 per square foot. 953 Coldwater Falls Way is a home located in Clark County with nearby schools including John R Beatty Elementary School, Jack Lund Schofield Middle School, and Silverado High School.
Ownership History
Date
Name
Owned For
Owner Type
Purchase Details
Closed on
Jun 13, 2025
Sold by
Stan K Trexler Spendthrift Trust and Trexler Stan K
Bought by
Stan Trexler Properties Llc
Current Estimated Value
Purchase Details
Closed on
May 28, 2015
Sold by
Lurkins Family Revocable Living Trust
Bought by
Trexler Stan K and Stan K Trexler Spendthrift Trust
Purchase Details
Closed on
Mar 2, 2010
Sold by
Lurkins Michael P and Lurkins Jean V
Bought by
Lurkins Michael and Lurkins Jean
Purchase Details
Closed on
Feb 17, 2002
Sold by
Gurera John
Bought by
Lurkins Michael P and Lurkins Jean
Home Financials for this Owner
Home Financials are based on the most recent Mortgage that was taken out on this home.
Original Mortgage
$150,000
Interest Rate
6.84%
Purchase Details
Closed on
Jun 15, 1998
Sold by
Bilt Perma
Bought by
Gurera John
Home Financials for this Owner
Home Financials are based on the most recent Mortgage that was taken out on this home.
Original Mortgage
$159,000
Interest Rate
7.11%
Create a Home Valuation Report for This Property
The Home Valuation Report is an in-depth analysis detailing your home's value as well as a comparison with similar homes in the area
Home Values in the Area
Average Home Value in this Area
Purchase History
| Date | Buyer | Sale Price | Title Company |
|---|---|---|---|
| Stan Trexler Properties Llc | -- | None Listed On Document | |
| Trexler Stan K | $298,000 | Ticor Title Las Vegas | |
| Lurkins Michael | -- | None Available | |
| Lurkins Michael P | $245,000 | Old Republic Title Company | |
| Gurera John | $199,000 | Nevada Title Company |
Source: Public Records
Mortgage History
| Date | Status | Borrower | Loan Amount |
|---|---|---|---|
| Previous Owner | Lurkins Jean | $139,000 | |
| Previous Owner | Lurkins Michael P | $136,500 | |
| Previous Owner | Lurkins Michael P | $150,000 | |
| Previous Owner | Gurera John | $159,000 |
Source: Public Records
Tax History Compared to Growth
Tax History
| Year | Tax Paid | Tax Assessment Tax Assessment Total Assessment is a certain percentage of the fair market value that is determined by local assessors to be the total taxable value of land and additions on the property. | Land | Improvement |
|---|---|---|---|---|
| 2025 | $2,775 | $142,862 | $45,500 | $97,362 |
| 2024 | $2,694 | $142,862 | $45,500 | $97,362 |
| 2023 | $2,694 | $134,482 | $42,000 | $92,482 |
| 2022 | $2,868 | $120,543 | $35,700 | $84,843 |
| 2021 | $2,656 | $111,812 | $31,150 | $80,662 |
| 2020 | $2,463 | $109,477 | $29,750 | $79,727 |
| 2019 | $2,308 | $106,732 | $28,000 | $78,732 |
| 2018 | $2,202 | $100,854 | $24,500 | $76,354 |
| 2017 | $3,018 | $102,917 | $25,200 | $77,717 |
| 2016 | $2,062 | $94,590 | $16,800 | $77,790 |
| 2015 | $2,058 | $75,547 | $13,300 | $62,247 |
| 2014 | $1,448 | $71,364 | $8,750 | $62,614 |
Source: Public Records
Map
Nearby Homes
- 1006 Coldwater Falls Way
- 8777 Shady Peak Way Unit 2
- 8880 Star Valley Ct
- 8870 Star Canyon Way
- 8940 Sandy Slate Way
- 1058 Warm Canyon Way
- 875 Rainbow Rock St
- 8698 Waterford Bend St
- 1115 Aldenwood Ave
- 8959 Coral Shale St
- 971 Whispering Grove Ave
- 1123 Aldenwood Ave
- 927 Clear Diamond Ave
- 960 Clear Diamond Ave
- 8840 Quintane Ln
- 920 Clear Diamond Ave
- 9076 Quarrystone Way
- 861 Clear Diamond Ave
- 896 Clear Diamond Ave
- 1058 Silver Stone Way Unit 3
- 963 Coldwater Falls Way
- 943 Coldwater Falls Way
- 933 Coldwater Falls Way
- 973 Coldwater Falls Way
- 946 Coldwater Falls Way
- 966 Coldwater Falls Way
- 970 Garden Breeze Way
- 925 Coldwater Falls Way
- 983 Coldwater Falls Way
- 980 Garden Breeze Way
- 936 Coldwater Falls Way
- 960 Garden Breeze Way Unit 4
- 950 Garden Breeze Way
- 976 Coldwater Falls Way Unit 6
- 930 Coldwater Falls Way
- 917 Coldwater Falls Way
- 993 Coldwater Falls Way
- 8765 Crest Basin Ct
- 940 Garden Breeze Way