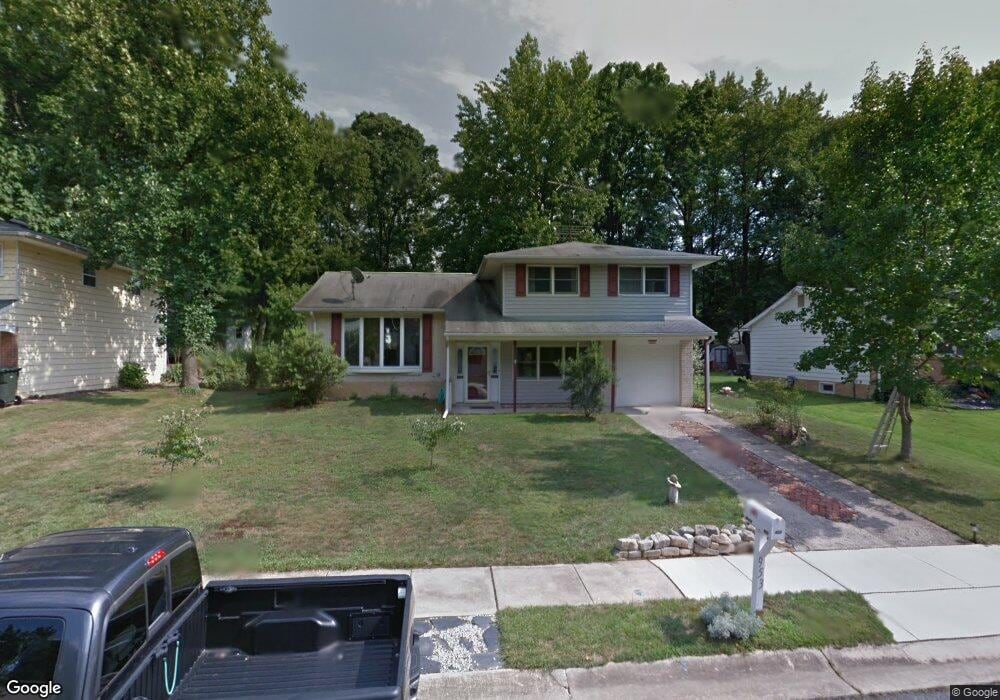
953 Devon Dr Newark, DE 19711
Estimated Value: $297,000 - $404,339
3
Beds
2
Baths
1,280
Sq Ft
$288/Sq Ft
Est. Value
About This Home
This home is located at 953 Devon Dr, Newark, DE 19711 and is currently estimated at $368,585, approximately $287 per square foot. 953 Devon Dr is a home located in New Castle County with nearby schools including West Park Place Elementary School, Shue-Medill Middle School, and Newark High School.
Ownership History
Date
Name
Owned For
Owner Type
Purchase Details
Closed on
May 29, 2020
Sold by
Frick Sian and Frick Timothy
Bought by
Murphy Clifford J
Current Estimated Value
Home Financials for this Owner
Home Financials are based on the most recent Mortgage that was taken out on this home.
Original Mortgage
$246,568
Outstanding Balance
$218,014
Interest Rate
3.3%
Mortgage Type
VA
Estimated Equity
$150,571
Purchase Details
Closed on
Jan 1, 1979
Bought by
Frick Hugh E and Frick Sian E
Create a Home Valuation Report for This Property
The Home Valuation Report is an in-depth analysis detailing your home's value as well as a comparison with similar homes in the area
Home Values in the Area
Average Home Value in this Area
Purchase History
| Date | Buyer | Sale Price | Title Company |
|---|---|---|---|
| Murphy Clifford J | -- | None Available | |
| Frick Hugh E | $42,500 | -- |
Source: Public Records
Mortgage History
| Date | Status | Borrower | Loan Amount |
|---|---|---|---|
| Open | Murphy Clifford J | $246,568 |
Source: Public Records
Tax History
| Year | Tax Paid | Tax Assessment Tax Assessment Total Assessment is a certain percentage of the fair market value that is determined by local assessors to be the total taxable value of land and additions on the property. | Land | Improvement |
|---|---|---|---|---|
| 2024 | $672 | $63,700 | $17,300 | $46,400 |
| 2023 | $2,303 | $63,700 | $17,300 | $46,400 |
| 2022 | $2,279 | $63,700 | $17,300 | $46,400 |
| 2021 | $2,221 | $63,700 | $17,300 | $46,400 |
| 2020 | $2,157 | $63,700 | $17,300 | $46,400 |
| 2019 | $1,491 | $63,700 | $17,300 | $46,400 |
| 2018 | $9,856 | $63,700 | $17,300 | $46,400 |
| 2017 | $493 | $63,700 | $17,300 | $46,400 |
| 2016 | $1,287 | $63,700 | $17,300 | $46,400 |
| 2015 | $1,102 | $63,700 | $17,300 | $46,400 |
| 2014 | $1,101 | $63,700 | $17,300 | $46,400 |
Source: Public Records
Map
Nearby Homes
- 306 Willa Rd
- 126 Manns Ave
- 30 Julie Ln
- 57 W Park Place
- 153 King William St Unit 153
- 117 W Shetland Ct
- 313 Chickory Way
- 105 Tanglewood Ln
- 710 S College Ave
- 2 Michigan State Dr
- 48 Arizona State Dr
- 716 S College Ave
- 289 W Chestnut Hill Rd
- 803 Del Grove Ave
- 317 Cannons Way
- 84 Welsh Tract Rd Unit 311
- 76 Welsh Tract Rd Unit 308
- 28 Buttercup Cir
- 25 Glyn Dr
- 22 Alwyn Rd
Your Personal Tour Guide
Ask me questions while you tour the home.