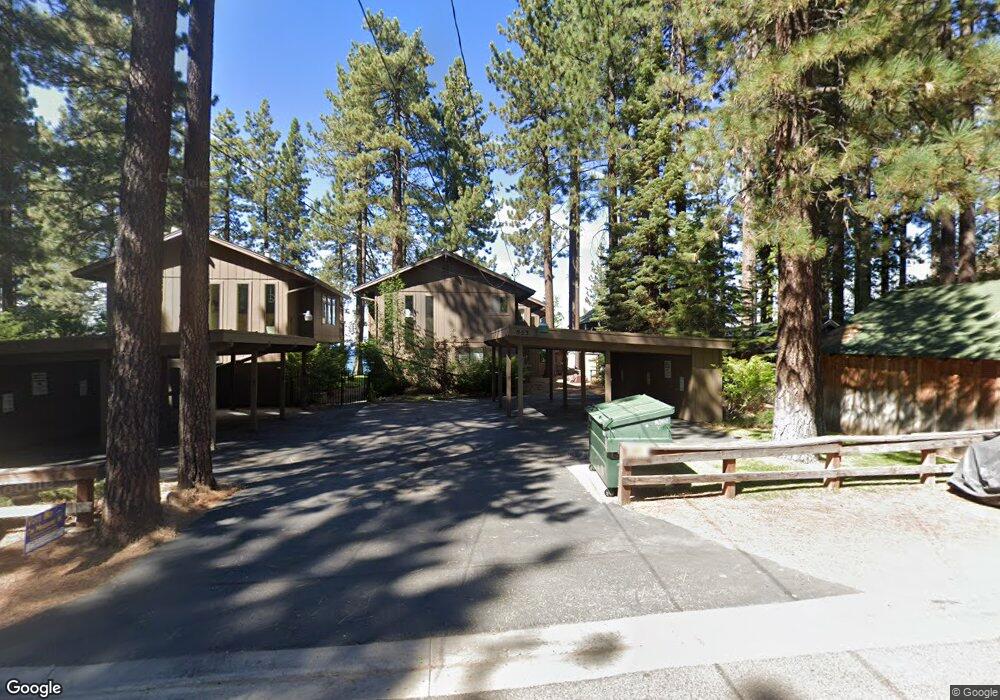
953 Lakeview Ave Unit 5 South Lake Tahoe, CA 96150
Estimated Value: $659,732 - $736,000
3
Beds
2
Baths
1,320
Sq Ft
$535/Sq Ft
Est. Value
About This Home
This home is located at 953 Lakeview Ave Unit 5, South Lake Tahoe, CA 96150 and is currently estimated at $705,933, approximately $534 per square foot. 953 Lakeview Ave Unit 5 is a home located in El Dorado County with nearby schools including Bijou Community, South Tahoe Middle School, and South Tahoe High School.
Ownership History
Date
Name
Owned For
Owner Type
Purchase Details
Closed on
Aug 13, 2015
Sold by
Sesser Carol I and Tillman Jeffery R
Bought by
Sesser Carol I and Tillman Jeffery R
Current Estimated Value
Purchase Details
Closed on
Jul 27, 1999
Sold by
Sesser James D and Sesser Carol I
Bought by
Sesser James D and Sesser Carol I
Home Financials for this Owner
Home Financials are based on the most recent Mortgage that was taken out on this home.
Original Mortgage
$196,750
Interest Rate
6.9%
Purchase Details
Closed on
Jun 7, 1999
Sold by
Finck Lucia J Tr and Finck Rev Trust Of 1988 Etal
Bought by
Sesser James and Sesser Carol
Home Financials for this Owner
Home Financials are based on the most recent Mortgage that was taken out on this home.
Original Mortgage
$196,750
Interest Rate
6.9%
Purchase Details
Closed on
Apr 19, 1995
Sold by
Finck Lucia J
Bought by
Finck Lucia J and The Lucia J Finck Trust Of 198
Create a Home Valuation Report for This Property
The Home Valuation Report is an in-depth analysis detailing your home's value as well as a comparison with similar homes in the area
Home Values in the Area
Average Home Value in this Area
Purchase History
| Date | Buyer | Sale Price | Title Company |
|---|---|---|---|
| Sesser Carol I | -- | None Available | |
| Sesser James D | -- | -- | |
| Sesser James | $246,000 | Fidelity National Title Co | |
| Finck Lucia J | -- | -- |
Source: Public Records
Mortgage History
| Date | Status | Borrower | Loan Amount |
|---|---|---|---|
| Closed | Sesser James | $196,750 |
Source: Public Records
Tax History Compared to Growth
Tax History
| Year | Tax Paid | Tax Assessment Tax Assessment Total Assessment is a certain percentage of the fair market value that is determined by local assessors to be the total taxable value of land and additions on the property. | Land | Improvement |
|---|---|---|---|---|
| 2025 | $4,100 | $385,626 | $76,802 | $308,824 |
| 2024 | $4,100 | $378,066 | $75,297 | $302,769 |
| 2023 | $4,023 | $370,654 | $73,821 | $296,833 |
| 2022 | $3,989 | $363,387 | $72,374 | $291,013 |
| 2021 | $3,928 | $356,262 | $70,955 | $285,307 |
| 2020 | $3,871 | $352,610 | $70,228 | $282,382 |
| 2019 | $3,852 | $345,697 | $68,851 | $276,846 |
| 2018 | $3,767 | $338,919 | $67,501 | $271,418 |
| 2017 | $3,708 | $332,275 | $66,178 | $266,097 |
| 2016 | $3,633 | $325,761 | $64,881 | $260,880 |
| 2015 | $3,449 | $320,869 | $63,907 | $256,962 |
| 2014 | $3,449 | $314,586 | $62,656 | $251,930 |
Source: Public Records
Map
Nearby Homes
- 960 San Francisco Ave
- 3140 Sacramento Ave
- 841 Merced Ave Unit 13
- 877 Los Angeles Ave
- 3334 Treehaven Dr
- 1048 Trout Creek Ave
- 3338 Treehaven Dr
- 761 Lakeview Ave
- 3339 Cape Horn Rd
- 3371 Lake Tahoe Blvd Unit 6
- 731 Tallac Ave
- 3275 Marlette Cir
- 1149 Oak Ave
- 1094 Johnson Blvd
- 869 Placer Ave
- 693 Modesto Ave
- 3229 Marlette Cir
- 1022 Fairway Ave
- 920 Balbijou Rd Unit 229
- 3508 Fawn Way
- 953 Lakeview Ave
- 953 Lakeview Ave Unit 6
- 953 Lakeview Ave Unit 4
- 953 Lakeview Ave Unit 3
- 953 Lakeview Ave Unit 2
- 953 Lakeview Ave Unit 1
- 961 Lakeview Ave
- 949 Lakeview Ave
- 945 Lakeview Ave
- 945 Lakeview Ave Unit B
- 956 Lakeview Ave
- 950 Lakeview Ave
- 969 Lakeview Ave
- 969 Lakeview Ave Unit A-B
- 969 Lakeview Ave Unit 4
- 969 Lakeview Ave Unit 5
- 969 Lakeview Ave Unit 3
- 969 Lakeview Ave Unit 2
- 969 Lakeview Ave Unit 1
- 960 Lakeview Ave Unit A