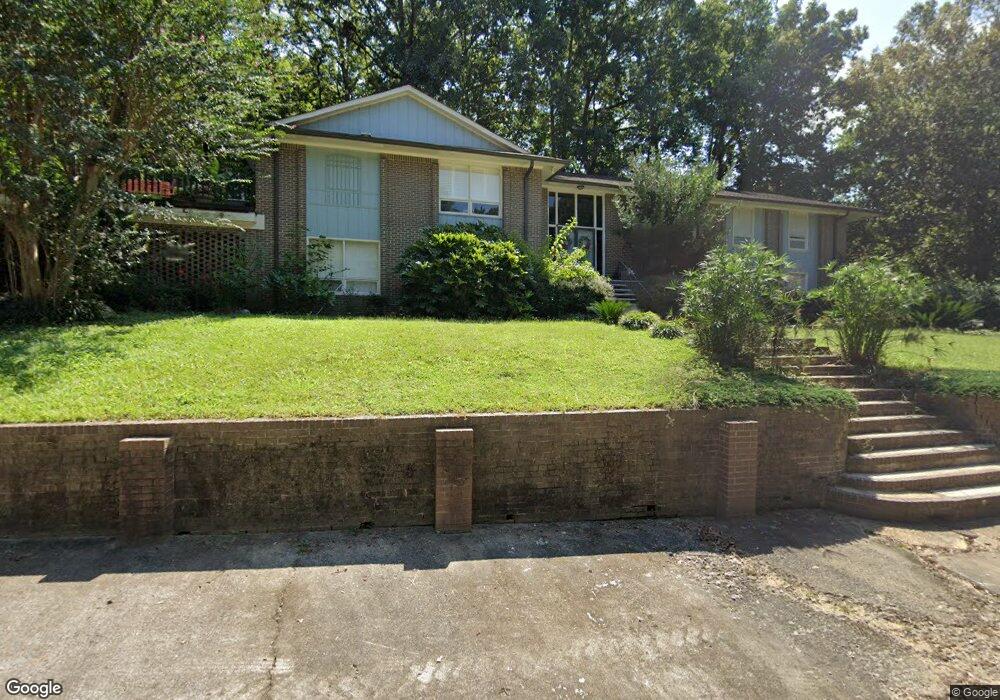
953 Riverview Dr West Columbia, SC 29169
Estimated Value: $332,000 - $530,273
5
Beds
4
Baths
4,710
Sq Ft
$90/Sq Ft
Est. Value
About This Home
This home is located at 953 Riverview Dr, West Columbia, SC 29169 and is currently estimated at $425,068, approximately $90 per square foot. 953 Riverview Dr is a home located in Lexington County with nearby schools including Saluda River Academy For The Arts, Northside Middle, and Brookland-Cayce High School.
Ownership History
Date
Name
Owned For
Owner Type
Purchase Details
Closed on
Jan 29, 2018
Sold by
Mcfarland Kevin A
Bought by
Conner Timothy Ray and Conner Patricia Diane
Current Estimated Value
Purchase Details
Closed on
Feb 17, 2017
Sold by
Sue Allen
Bought by
Mcfarland Kevin
Home Financials for this Owner
Home Financials are based on the most recent Mortgage that was taken out on this home.
Original Mortgage
$165,000
Interest Rate
4.15%
Purchase Details
Closed on
Oct 21, 2015
Sold by
Fannie Mae
Bought by
Mcfarland Kevin A
Purchase Details
Closed on
Jul 14, 2015
Sold by
Frankfurth Betty
Bought by
Federal National Mortgage Association and Fannie Mae
Purchase Details
Closed on
May 5, 2011
Sold by
Estate Of Dale Frankfurth and Brown W Steven
Bought by
Frankfurth Betty
Create a Home Valuation Report for This Property
The Home Valuation Report is an in-depth analysis detailing your home's value as well as a comparison with similar homes in the area
Home Values in the Area
Average Home Value in this Area
Purchase History
| Date | Buyer | Sale Price | Title Company |
|---|---|---|---|
| Conner Timothy Ray | $245,000 | None Available | |
| Mcfarland Kevin | -- | -- | |
| Mcfarland Kevin A | $141,500 | None Available | |
| Federal National Mortgage Association | $188,324 | -- | |
| Frankfurth Betty | -- | -- |
Source: Public Records
Mortgage History
| Date | Status | Borrower | Loan Amount |
|---|---|---|---|
| Previous Owner | Mcfarland Kevin | $165,000 | |
| Previous Owner | Mcfarland Kevin | -- |
Source: Public Records
Tax History Compared to Growth
Tax History
| Year | Tax Paid | Tax Assessment Tax Assessment Total Assessment is a certain percentage of the fair market value that is determined by local assessors to be the total taxable value of land and additions on the property. | Land | Improvement |
|---|---|---|---|---|
| 2024 | $5,811 | $14,722 | $2,160 | $12,562 |
| 2023 | $5,811 | $14,722 | $2,160 | $12,562 |
| 2022 | $5,503 | $14,722 | $2,160 | $12,562 |
| 2020 | $5,218 | $14,722 | $2,160 | $12,562 |
| 2019 | $5,264 | $14,700 | $2,520 | $12,180 |
| 2018 | $5,487 | $15,448 | $2,520 | $12,928 |
| 2017 | $1,283 | $7,000 | $1,680 | $5,320 |
| 2016 | $1,320 | $7,000 | $1,680 | $5,320 |
| 2015 | $828 | $9,728 | $1,460 | $8,268 |
| 2014 | $828 | $8,460 | $1,540 | $6,920 |
| 2013 | -- | $8,460 | $1,540 | $6,920 |
Source: Public Records
Map
Nearby Homes
- 634 Edgewater Ln
- 916 Mohegan Trail
- 912 Natchez Trail
- 913 Natchez Trail
- 412 Edgewater Ln Unit 412
- 225 Edgewater Ln
- 121 Edgewater Ln
- 134 Edgewater Ln Unit 134
- 918 N Lucas St
- 1075 Laurel Crest Dr
- 1085 Laurel Crest Dr
- 3 Lynnwood Rd
- 103 Chicorana Rd
- 929-931 Central Dr
- 1344 Gilmore St
- 638 Carrington Dr
- 502A Koon St
- 1513 Gambrell St
- 108 Double Branch Ct
- 603 Skyland Dr
- 1020 Natchez Trail
- 945 Riverview Dr
- 1016 Natchez Trail
- 968 Riverview Dr
- 941 Mohegan Trail
- 943 Mohegan Trail
- 1025 Natchez Trail
- 1029 Natchez Trail
- 1021 Natchez Trail
- 1012 Natchez Trail
- 960 Riverview Dr
- 956 Riverview Dr
- 937 Mohegan Trail
- 1037 Natchez Trail
- 1008 Natchez Trail
- 937 Riverview Dr
- 1013 Natchez Trail
- 1024 Fontanna Ave
- 1020 Fontanna Ave
- 1100 Fontanna Ave