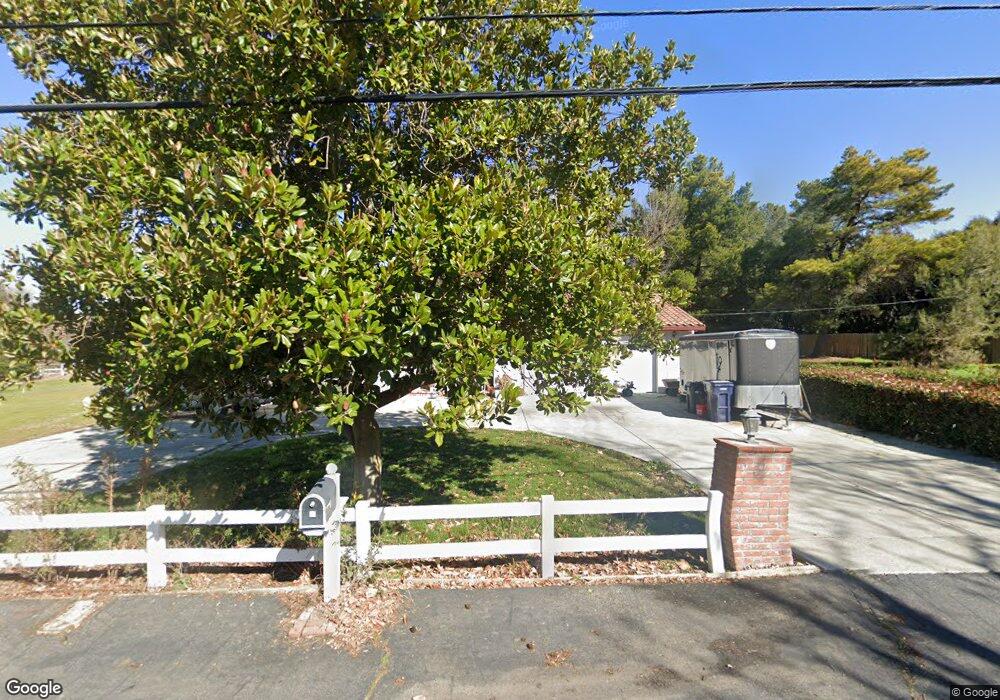
9540 Santa Lucia Rd Atascadero, CA 93422
Estimated Value: $723,561 - $973,000
2
Beds
2
Baths
1,250
Sq Ft
$648/Sq Ft
Est. Value
About This Home
This home is located at 9540 Santa Lucia Rd, Atascadero, CA 93422 and is currently estimated at $809,390, approximately $647 per square foot. 9540 Santa Lucia Rd is a home located in San Luis Obispo County with nearby schools including Monterey Road Elementary School, Atascadero Middle School, and Atascadero High School.
Ownership History
Date
Name
Owned For
Owner Type
Purchase Details
Closed on
Sep 16, 2010
Sold by
Wall John W and Wall Sharon L
Bought by
Wall John W and Wall Sharon L
Current Estimated Value
Purchase Details
Closed on
May 21, 2009
Sold by
Conlan Kevin
Bought by
Wall John W and Wall Sharon
Purchase Details
Closed on
Nov 11, 2003
Sold by
Allen Helen L
Bought by
Conlan Kevin and Wall John
Home Financials for this Owner
Home Financials are based on the most recent Mortgage that was taken out on this home.
Original Mortgage
$286,400
Interest Rate
6.04%
Mortgage Type
Unknown
Create a Home Valuation Report for This Property
The Home Valuation Report is an in-depth analysis detailing your home's value as well as a comparison with similar homes in the area
Home Values in the Area
Average Home Value in this Area
Purchase History
| Date | Buyer | Sale Price | Title Company |
|---|---|---|---|
| Wall John W | -- | Accommodation | |
| Wall John W | $70,000 | None Available | |
| Conlan Kevin | $358,000 | Fidelity Title Company |
Source: Public Records
Mortgage History
| Date | Status | Borrower | Loan Amount |
|---|---|---|---|
| Previous Owner | Conlan Kevin | $286,400 |
Source: Public Records
Tax History Compared to Growth
Tax History
| Year | Tax Paid | Tax Assessment Tax Assessment Total Assessment is a certain percentage of the fair market value that is determined by local assessors to be the total taxable value of land and additions on the property. | Land | Improvement |
|---|---|---|---|---|
| 2025 | $5,079 | $473,400 | $270,947 | $202,453 |
| 2024 | $5,076 | $464,119 | $265,635 | $198,484 |
| 2023 | $5,076 | $455,020 | $260,427 | $194,593 |
| 2022 | $5,011 | $446,099 | $255,321 | $190,778 |
| 2021 | $4,912 | $437,353 | $250,315 | $187,038 |
| 2020 | $4,860 | $432,870 | $247,749 | $185,121 |
| 2019 | $4,764 | $424,384 | $242,892 | $181,492 |
| 2018 | $4,669 | $416,064 | $238,130 | $177,934 |
| 2017 | $4,576 | $407,907 | $233,461 | $174,446 |
| 2016 | $4,564 | $399,910 | $228,884 | $171,026 |
| 2015 | $4,279 | $375,000 | $215,000 | $160,000 |
| 2014 | $3,827 | $360,000 | $205,000 | $155,000 |
Source: Public Records
Map
Nearby Homes
- 9170 Santa Lucia Rd
- 9080 Santa Lucia Rd
- 6452 Alta Pradera Ln
- 6360 Navarette Ave
- 5725 Chauplin Ave
- 6525 Navarette Ave
- 3880 Ardilla Rd
- 7505 El Retiro Ave
- 5450 Pescado Ct
- 7215 San Gabriel Rd
- 5929 Gran Paseo Way
- 4615 El Camino Real
- 9240 Carmelita Ave
- 7906 Curbaril Ave
- 5955 Traffic Way
- 6855 Atascadero Ave
- 7250 Morro Rd
- 7300 Morro Rd
- 5200 Fresno Ave
- 7100 Morro Rd
- 9500 Santa Lucia Rd
- 9600 Santa Lucia Rd
- 9555 Santa Lucia Rd
- 5825 Cascabel Rd
- 9585 Santa Lucia Rd
- 9450 Santa Lucia Rd
- 9465 Santa Lucia Rd
- 9630 Santa Lucia Rd
- 9650 Santa Lucia Rd
- 9455 Santa Lucia Rd
- 9467 Santa Lucia Rd
- 9425 Santa Lucia Rd
- 5809 Cascabel Rd
- 5805 Cascabel Rd
- 9637 Santa Lucia Rd
- 9635 Santa Lucia Rd
- 9525 Santa Lucia Rd
- 9405 Santa Lucia Rd
- 9469 Santa Lucia Rd
- 9505 Santa Lucia Rd