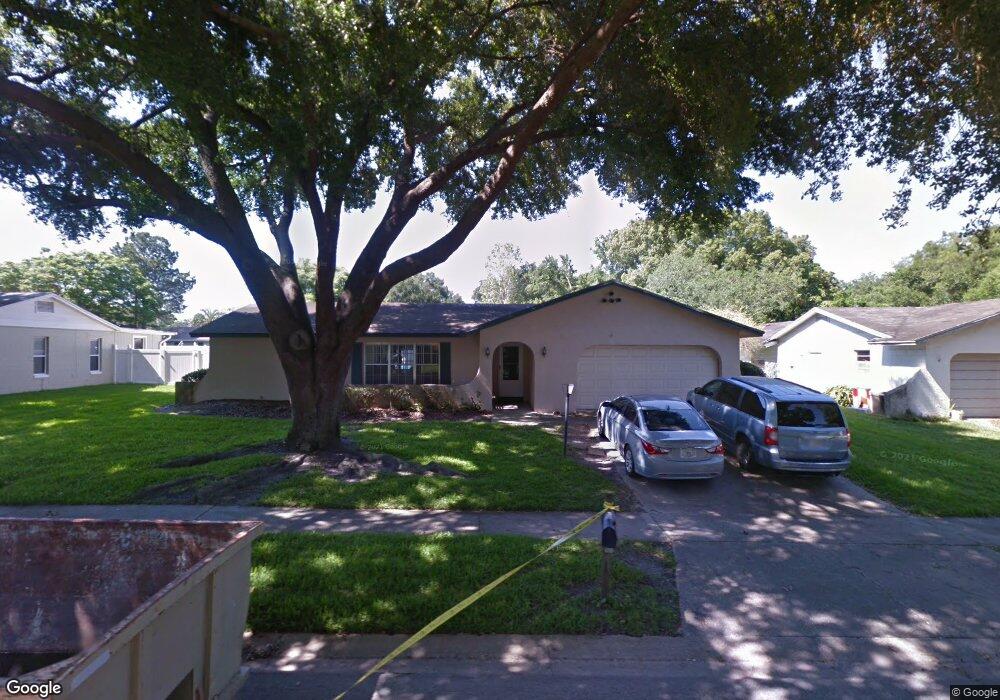
955 Briarwood Ln Altamonte Springs, FL 32714
Spring Valley NeighborhoodEstimated Value: $341,000 - $381,000
3
Beds
2
Baths
1,654
Sq Ft
$220/Sq Ft
Est. Value
About This Home
This home is located at 955 Briarwood Ln, Altamonte Springs, FL 32714 and is currently estimated at $364,686, approximately $220 per square foot. 955 Briarwood Ln is a home located in Seminole County with nearby schools including Forest City Elementary School, Teague Middle School, and Lake Brantley High School.
Ownership History
Date
Name
Owned For
Owner Type
Purchase Details
Closed on
Jan 1, 1977
Bought by
Jenkins Dianne E
Current Estimated Value
Purchase Details
Closed on
Jan 1, 1975
Bought by
Jenkins Dianne E
Create a Home Valuation Report for This Property
The Home Valuation Report is an in-depth analysis detailing your home's value as well as a comparison with similar homes in the area
Home Values in the Area
Average Home Value in this Area
Purchase History
| Date | Buyer | Sale Price | Title Company |
|---|---|---|---|
| Jenkins Dianne E | $39,400 | -- | |
| Jenkins Dianne E | $33,500 | -- |
Source: Public Records
Tax History Compared to Growth
Tax History
| Year | Tax Paid | Tax Assessment Tax Assessment Total Assessment is a certain percentage of the fair market value that is determined by local assessors to be the total taxable value of land and additions on the property. | Land | Improvement |
|---|---|---|---|---|
| 2024 | -- | $127,110 | -- | -- |
| 2023 | $0 | $123,408 | $0 | $0 |
| 2021 | $0 | $116,324 | $0 | $0 |
| 2020 | $0 | $114,718 | $0 | $0 |
| 2019 | $0 | $112,139 | $0 | $0 |
| 2018 | $0 | $110,048 | $0 | $0 |
| 2017 | $0 | $107,785 | $0 | $0 |
| 2016 | -- | $106,307 | $0 | $0 |
| 2015 | -- | $104,834 | $0 | $0 |
| 2014 | -- | $104,002 | $0 | $0 |
Source: Public Records
Map
Nearby Homes
- 815 Richbee Dr
- 700 Seabrook Ct Unit 102
- 709 Lighthouse Ct
- 706 Lighthouse Ct
- 698 Seabrook Ct Unit 206
- 671 Sandy Neck Ln Unit 102
- 1007 Casa Del Sol Cir
- 795 Little Wekiwa Dr
- 1009 Woodall Dr
- 974 Leeward Place Unit 205
- 642 Dory Ln Unit 304
- 976 Leeward Place Unit 101
- 976 Leeward Place Unit 102
- 980 Mooring Ave Unit 103
- 980 Mooring Ave Unit 105
- 637 Buoy Ln Unit 203
- 627 Dory Ln Unit 304
- 627 Dory Ln Unit 102
- 627 Dory Ln Unit 202
- 633 Buoy Ln Unit 304