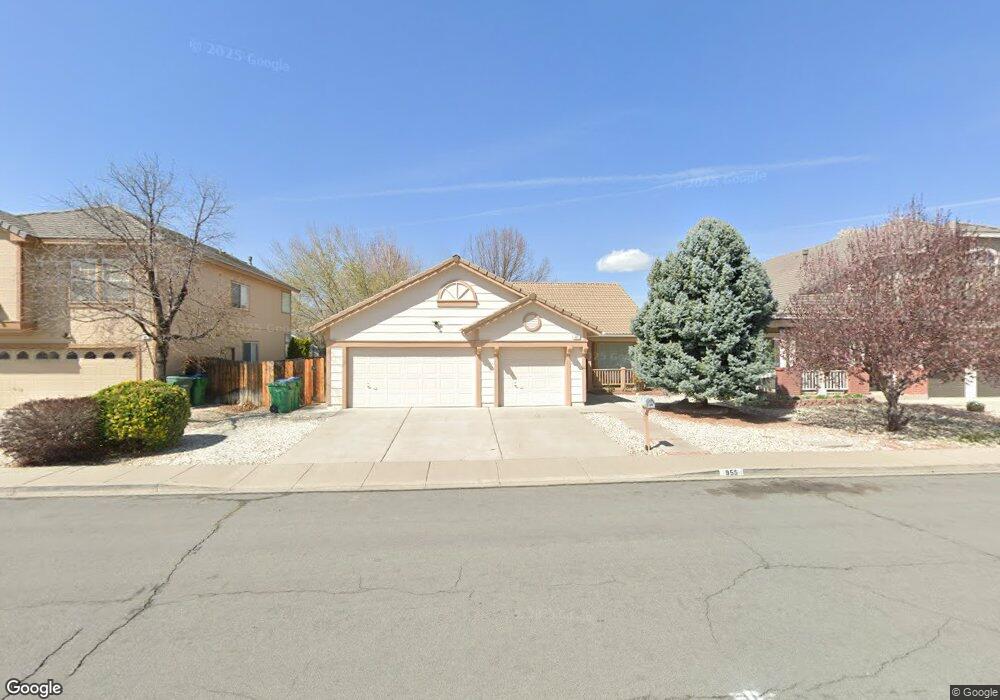
955 Dolce Dr Sparks, NV 89434
D'Andrea NeighborhoodEstimated Value: $504,935 - $543,000
3
Beds
2
Baths
1,608
Sq Ft
$325/Sq Ft
Est. Value
About This Home
This home is located at 955 Dolce Dr, Sparks, NV 89434 and is currently estimated at $523,234, approximately $325 per square foot. 955 Dolce Dr is a home located in Washoe County with nearby schools including Marvin Moss Elementary School, Lou Mendive Middle School, and Edward C Reed High School.
Ownership History
Date
Name
Owned For
Owner Type
Purchase Details
Closed on
Jul 19, 2021
Sold by
Thiessens Jay W and Thiessens Bonnie Jean
Bought by
Thiessens Family Holdings Llc
Current Estimated Value
Purchase Details
Closed on
May 6, 2004
Sold by
Thiessens Jay W and Thiessens Bonnie Jean
Bought by
Thiessens Jay W and Thiessens Bonnie J
Home Financials for this Owner
Home Financials are based on the most recent Mortgage that was taken out on this home.
Original Mortgage
$176,000
Outstanding Balance
$79,956
Interest Rate
5.38%
Mortgage Type
New Conventional
Estimated Equity
$443,278
Purchase Details
Closed on
Dec 14, 2000
Sold by
Tolosano Caterina
Bought by
Thiessens Jay W and Thiessens Bonnie J
Home Financials for this Owner
Home Financials are based on the most recent Mortgage that was taken out on this home.
Original Mortgage
$65,200
Interest Rate
7.81%
Purchase Details
Closed on
Oct 3, 1995
Sold by
Lewis Homes Of Nevada
Bought by
Tolosano Caterina
Create a Home Valuation Report for This Property
The Home Valuation Report is an in-depth analysis detailing your home's value as well as a comparison with similar homes in the area
Home Values in the Area
Average Home Value in this Area
Purchase History
| Date | Buyer | Sale Price | Title Company |
|---|---|---|---|
| Thiessens Family Holdings Llc | -- | None Available | |
| Thiessens Jay W | -- | Western Title Incorporated | |
| Thiessens Jay W | $177,000 | First American Title Co | |
| Tolosano Caterina | $157,000 | Stewart Title |
Source: Public Records
Mortgage History
| Date | Status | Borrower | Loan Amount |
|---|---|---|---|
| Open | Thiessens Jay W | $176,000 | |
| Closed | Thiessens Jay W | $65,200 |
Source: Public Records
Tax History
| Year | Tax Paid | Tax Assessment Tax Assessment Total Assessment is a certain percentage of the fair market value that is determined by local assessors to be the total taxable value of land and additions on the property. | Land | Improvement |
|---|---|---|---|---|
| 2026 | $1,905 | $107,090 | $45,045 | $62,045 |
| 2024 | $2,470 | $101,049 | $36,995 | $64,054 |
| 2023 | $2,400 | $102,181 | $41,370 | $60,811 |
| 2022 | $2,331 | $82,879 | $31,955 | $50,924 |
| 2021 | $2,262 | $78,259 | $27,405 | $50,854 |
| 2020 | $2,195 | $76,865 | $25,725 | $51,140 |
| 2019 | $2,090 | $72,051 | $23,030 | $49,021 |
| 2018 | $1,995 | $66,496 | $18,620 | $47,876 |
| 2017 | $1,905 | $66,180 | $18,585 | $47,595 |
| 2016 | $1,859 | $64,490 | $15,820 | $48,670 |
| 2015 | $1,855 | $62,487 | $13,755 | $48,732 |
| 2014 | $1,797 | $59,246 | $12,005 | $47,241 |
| 2013 | -- | $51,620 | $9,695 | $41,925 |
Source: Public Records
Map
Nearby Homes
- 1741 Medolla Dr
- 2152 Wabash Cir
- 1759 Veneto Dr
- 1750 Corleone Dr
- 1695 Atlantic Way
- 2600 Anqua Ct
- 2199 Lucca Ln
- 2264 Fernwood Ct
- 2485 Firenze Dr
- 1357 Coupler Ct
- 2688 Laguna Way
- 2854 Cintoia Dr
- 2227 Valencia Way
- 1655 Sabatino Dr
- 1674 Sabatino Dr
- 1308 Coachman Dr
- 0 Martini Rd Unit 260001673
- 2140 Burnside Dr
- 2624 Sunny Slope Dr Unit 10
- 2625 Sunny Slope Dr
Your Personal Tour Guide
Ask me questions while you tour the home.