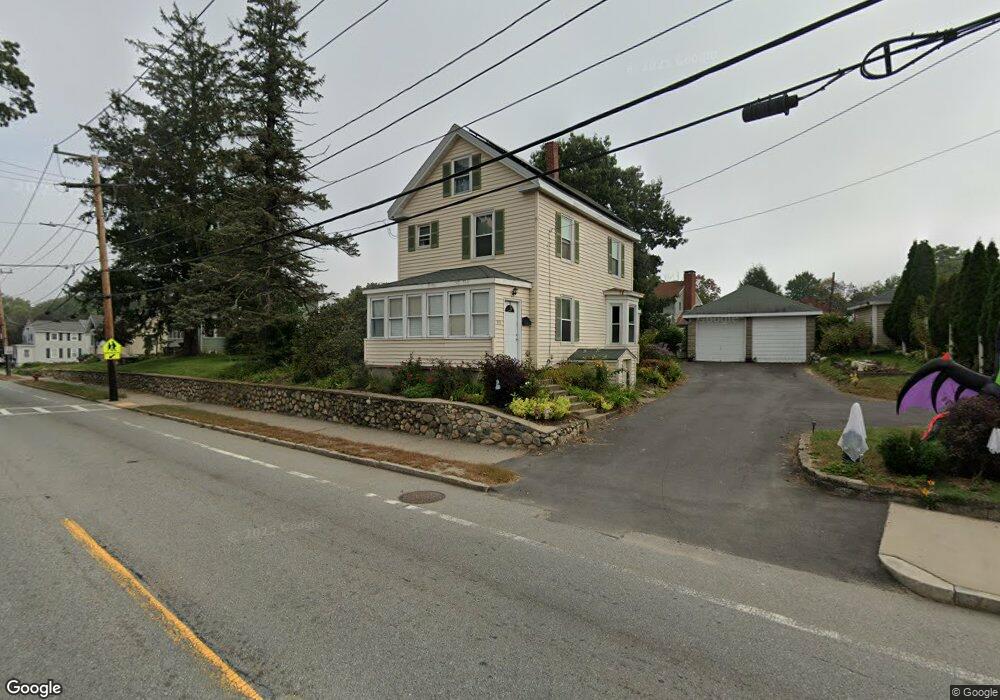
955 Main St Woburn, MA 01801
North Woburn NeighborhoodEstimated Value: $664,050 - $750,000
3
Beds
2
Baths
1,568
Sq Ft
$454/Sq Ft
Est. Value
About This Home
This home is located at 955 Main St, Woburn, MA 01801 and is currently estimated at $711,263, approximately $453 per square foot. 955 Main St is a home located in Middlesex County with nearby schools including Mary D. Altavesta Elementary School, John F. Kennedy Middle School, and Woburn High School.
Ownership History
Date
Name
Owned For
Owner Type
Purchase Details
Closed on
Feb 25, 2010
Sold by
Delleville Frances A and Hsbc Mortgage Corp
Bought by
Cris Investments Llc
Current Estimated Value
Home Financials for this Owner
Home Financials are based on the most recent Mortgage that was taken out on this home.
Original Mortgage
$27,000
Outstanding Balance
$17,800
Interest Rate
5.11%
Mortgage Type
Purchase Money Mortgage
Estimated Equity
$693,463
Create a Home Valuation Report for This Property
The Home Valuation Report is an in-depth analysis detailing your home's value as well as a comparison with similar homes in the area
Home Values in the Area
Average Home Value in this Area
Purchase History
| Date | Buyer | Sale Price | Title Company |
|---|---|---|---|
| Cris Investments Llc | $169,000 | -- | |
| Johnson Jeremy | $270,000 | -- | |
| Cris Investments Llc | $169,000 | -- | |
| Johnson Jeremy | $270,000 | -- | |
| Cris Investments Llc | $169,000 | -- |
Source: Public Records
Mortgage History
| Date | Status | Borrower | Loan Amount |
|---|---|---|---|
| Open | Cris Investments Llc | $27,000 | |
| Open | Johnson Jeremy | $216,000 | |
| Closed | Cris Investments Llc | $27,000 | |
| Closed | Johnson Jeremy | $216,000 |
Source: Public Records
Tax History Compared to Growth
Tax History
| Year | Tax Paid | Tax Assessment Tax Assessment Total Assessment is a certain percentage of the fair market value that is determined by local assessors to be the total taxable value of land and additions on the property. | Land | Improvement |
|---|---|---|---|---|
| 2025 | $4,867 | $569,900 | $283,800 | $286,100 |
| 2024 | $4,323 | $536,300 | $270,300 | $266,000 |
| 2023 | $4,347 | $499,600 | $245,700 | $253,900 |
| 2022 | $4,168 | $446,200 | $213,700 | $232,500 |
| 2021 | $6,963 | $409,100 | $203,500 | $205,600 |
| 2020 | $3,801 | $407,800 | $203,500 | $204,300 |
| 2019 | $6,597 | $391,400 | $193,800 | $197,600 |
| 2018 | $3,537 | $357,600 | $177,800 | $179,800 |
| 2017 | $3,351 | $337,100 | $169,400 | $167,700 |
| 2016 | $3,196 | $318,000 | $158,300 | $159,700 |
| 2015 | $3,073 | $302,200 | $147,900 | $154,300 |
| 2014 | $2,906 | $278,400 | $147,900 | $130,500 |
Source: Public Records
Map
Nearby Homes
- 953 Main St
- 951 Main St
- 951 Main St Unit B
- 951 Main St Unit A
- 961 Main St
- 961 Main St Unit 2
- 963 Main St
- 2 W Dexter Ave
- 4 W Dexter Ave Unit R
- 4 W Dexter Ave
- 980 Main St Unit 121
- 949 Main St Unit 13
- 949 Main St Unit 4
- 949 Main St Unit 1
- 949 Main St Unit D
- 949 Main St Unit 16
- 949 Main St Unit 15
- 949 Main St Unit 6
- 949 Main St Unit 5
- 949 Main St Unit B