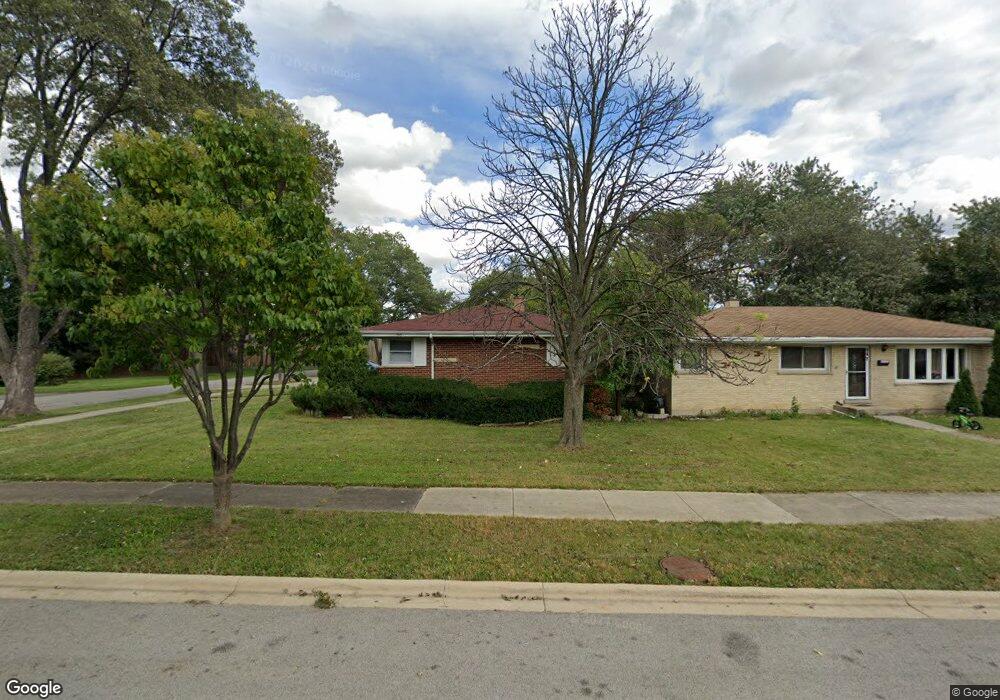
955 N Sumner St Addison, IL 60101
Estimated Value: $377,000 - $405,000
3
Beds
2
Baths
1,484
Sq Ft
$261/Sq Ft
Est. Value
About This Home
This home is located at 955 N Sumner St, Addison, IL 60101 and is currently estimated at $387,592, approximately $261 per square foot. 955 N Sumner St is a home located in DuPage County with nearby schools including Lincoln Elementary School, Indian Trail Jr High School, and Addison Trail High School.
Ownership History
Date
Name
Owned For
Owner Type
Purchase Details
Closed on
Dec 19, 2008
Sold by
Ray Graham Association For People With D
Bought by
Zepeda Jorge
Current Estimated Value
Home Financials for this Owner
Home Financials are based on the most recent Mortgage that was taken out on this home.
Original Mortgage
$110,000
Outstanding Balance
$72,895
Interest Rate
6.19%
Mortgage Type
Purchase Money Mortgage
Estimated Equity
$314,697
Purchase Details
Closed on
Jul 12, 2007
Sold by
Ray Graham Foundation
Bought by
Ray Graham Assn For People With Disabili
Purchase Details
Closed on
Oct 29, 1999
Sold by
Montano Joseph and Montano Rosalinda B
Bought by
Ray Graham Foundation
Home Financials for this Owner
Home Financials are based on the most recent Mortgage that was taken out on this home.
Original Mortgage
$110,000
Interest Rate
7.87%
Create a Home Valuation Report for This Property
The Home Valuation Report is an in-depth analysis detailing your home's value as well as a comparison with similar homes in the area
Home Values in the Area
Average Home Value in this Area
Purchase History
| Date | Buyer | Sale Price | Title Company |
|---|---|---|---|
| Zepeda Jorge | $200,000 | Chicago Title Insurance Co | |
| Ray Graham Assn For People With Disabili | -- | None Available | |
| Ray Graham Foundation | -- | -- | |
| Ray Graham Assn | $180,000 | -- |
Source: Public Records
Mortgage History
| Date | Status | Borrower | Loan Amount |
|---|---|---|---|
| Open | Zepeda Jorge | $110,000 | |
| Previous Owner | Ray Graham Assn | $110,000 | |
| Closed | Ray Graham Assn | $60,000 |
Source: Public Records
Tax History
| Year | Tax Paid | Tax Assessment Tax Assessment Total Assessment is a certain percentage of the fair market value that is determined by local assessors to be the total taxable value of land and additions on the property. | Land | Improvement |
|---|---|---|---|---|
| 2024 | $7,273 | $111,195 | $41,141 | $70,054 |
| 2023 | $6,936 | $102,220 | $37,820 | $64,400 |
| 2022 | $6,435 | $93,370 | $34,530 | $58,840 |
| 2021 | $6,162 | $89,430 | $33,070 | $56,360 |
| 2020 | $5,991 | $85,660 | $31,680 | $53,980 |
| 2019 | $5,946 | $82,360 | $30,460 | $51,900 |
| 2018 | $5,876 | $78,390 | $28,990 | $49,400 |
| 2017 | $5,721 | $74,920 | $27,710 | $47,210 |
| 2016 | $5,560 | $69,170 | $25,580 | $43,590 |
| 2015 | $5,413 | $63,900 | $23,630 | $40,270 |
| 2014 | $5,444 | $63,860 | $21,660 | $42,200 |
| 2013 | $5,335 | $65,160 | $22,100 | $43,060 |
Source: Public Records
Map
Nearby Homes
- 465 W Dominion Dr Unit 1001
- 539 W Eggerding Dr
- 981 N Mill Rd Unit 1
- 451 W Linda Ln
- 138 W Janice Ln
- 474 Elizabeth Dr Unit 17D
- 665 Catherine Ct Unit 31BR
- 483 Forest Preserve Dr Unit 2
- 734 N Briar Hill Ln Unit 3
- 720 N Briar Hill Ln Unit 5
- 730 N Briar Hill Ln Unit 1
- 724 N Briar Hill Ln Unit 3
- 649 N Briar Hill Ln Unit 3
- 488 W Jason Ln
- 543 N Chestnut St
- 4N163 5th Ave
- 4N327 7th Ave
- 245 N Mill Rd Unit 9C
- 235 N Mill Rd Unit 115B
- 551 N 6th Ave
- 949 N Sumner St
- 943 N Sumner St
- 954 N Lincoln St
- 948 N Lincoln St
- 937 N Sumner St
- 954 N Sumner St
- 948 N Sumner St
- 942 N Lincoln St
- 942 N Sumner St
- 936 N Lincoln St
- 931 N Sumner St
- 936 N Sumner St
- 930 N Lincoln St
- 925 N Sumner St
- 930 N Sumner St
- 949 N Lincoln St
- 924 N Lincoln St
- 955 N Neva Ave
- 943 N Lincoln St
- 949 N Neva Ave
Your Personal Tour Guide
Ask me questions while you tour the home.