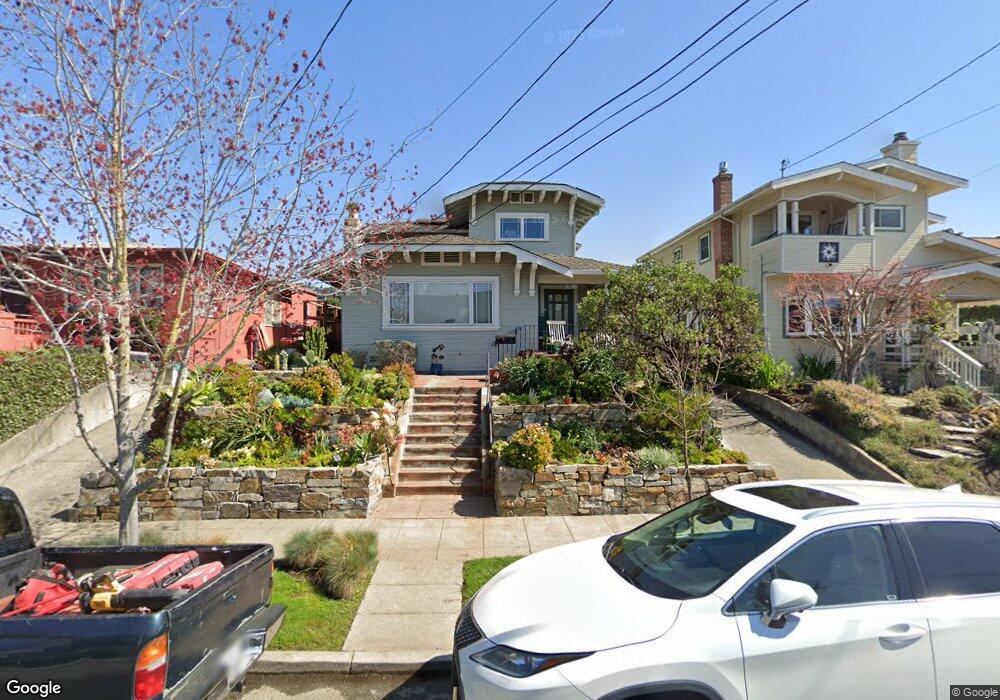
955 Ordway St Albany, CA 94706
Estimated Value: $1,969,000 - $2,376,000
4
Beds
3
Baths
2,427
Sq Ft
$900/Sq Ft
Est. Value
About This Home
This home is located at 955 Ordway St, Albany, CA 94706 and is currently estimated at $2,185,315, approximately $900 per square foot. 955 Ordway St is a home located in Alameda County with nearby schools including Albany Middle School, Albany High School, and The Crowden School.
Ownership History
Date
Name
Owned For
Owner Type
Purchase Details
Closed on
Nov 21, 2014
Sold by
Greensfelder David S and Buttwinick Karen D
Bought by
Greenbutt Living Trust
Current Estimated Value
Home Financials for this Owner
Home Financials are based on the most recent Mortgage that was taken out on this home.
Original Mortgage
$379,200
Outstanding Balance
$128,497
Interest Rate
3.92%
Mortgage Type
New Conventional
Estimated Equity
$2,056,818
Purchase Details
Closed on
Feb 15, 2002
Sold by
Greensfelder David S and Buttwinick Karen D
Bought by
Greensfelder David S and Buttwinick Karen D
Home Financials for this Owner
Home Financials are based on the most recent Mortgage that was taken out on this home.
Original Mortgage
$503,000
Interest Rate
7.13%
Purchase Details
Closed on
Feb 7, 2002
Sold by
Greensfelder David S and Buttwinick Karen D
Bought by
Greensfelder David S and Buttwinick Karen D
Home Financials for this Owner
Home Financials are based on the most recent Mortgage that was taken out on this home.
Original Mortgage
$503,000
Interest Rate
7.13%
Purchase Details
Closed on
Jun 7, 2000
Sold by
Greensfelder David and Buttwinick Karen
Bought by
Greensfelder David S and Buttwinick Karen D
Purchase Details
Closed on
Jun 17, 1996
Sold by
Bank John and Bank Magda
Bought by
Greensfelder David and Buttwinick Karen
Home Financials for this Owner
Home Financials are based on the most recent Mortgage that was taken out on this home.
Original Mortgage
$228,000
Interest Rate
8.25%
Mortgage Type
Seller Take Back
Create a Home Valuation Report for This Property
The Home Valuation Report is an in-depth analysis detailing your home's value as well as a comparison with similar homes in the area
Home Values in the Area
Average Home Value in this Area
Purchase History
| Date | Buyer | Sale Price | Title Company |
|---|---|---|---|
| Greenbutt Living Trust | -- | Fidelity National Title Co | |
| Greensfelder David S | -- | -- | |
| Greensfelder David S | -- | Old Republic Title Company | |
| Greensfelder David S | -- | -- | |
| Greensfelder David | $285,000 | Old Republic Title Company |
Source: Public Records
Mortgage History
| Date | Status | Borrower | Loan Amount |
|---|---|---|---|
| Open | Greenbutt Living Trust | $379,200 | |
| Closed | Greensfelder David S | $503,000 | |
| Closed | Greensfelder David | $228,000 |
Source: Public Records
Tax History Compared to Growth
Tax History
| Year | Tax Paid | Tax Assessment Tax Assessment Total Assessment is a certain percentage of the fair market value that is determined by local assessors to be the total taxable value of land and additions on the property. | Land | Improvement |
|---|---|---|---|---|
| 2025 | $11,802 | $584,708 | $142,029 | $449,679 |
| 2024 | $11,802 | $573,107 | $139,244 | $440,863 |
| 2023 | $10,794 | $568,733 | $136,514 | $432,219 |
| 2022 | $10,247 | $550,584 | $133,838 | $423,746 |
| 2021 | $10,094 | $539,652 | $131,214 | $415,438 |
| 2020 | $9,945 | $541,049 | $129,869 | $411,180 |
| 2019 | $9,721 | $530,441 | $127,323 | $403,118 |
| 2018 | $9,448 | $520,043 | $124,827 | $395,216 |
| 2017 | $9,211 | $509,849 | $122,380 | $387,469 |
| 2016 | $8,765 | $499,854 | $119,981 | $379,873 |
| 2015 | $8,211 | $492,348 | $118,179 | $374,169 |
| 2014 | $8,058 | $482,707 | $115,865 | $366,842 |
Source: Public Records
Map
Nearby Homes