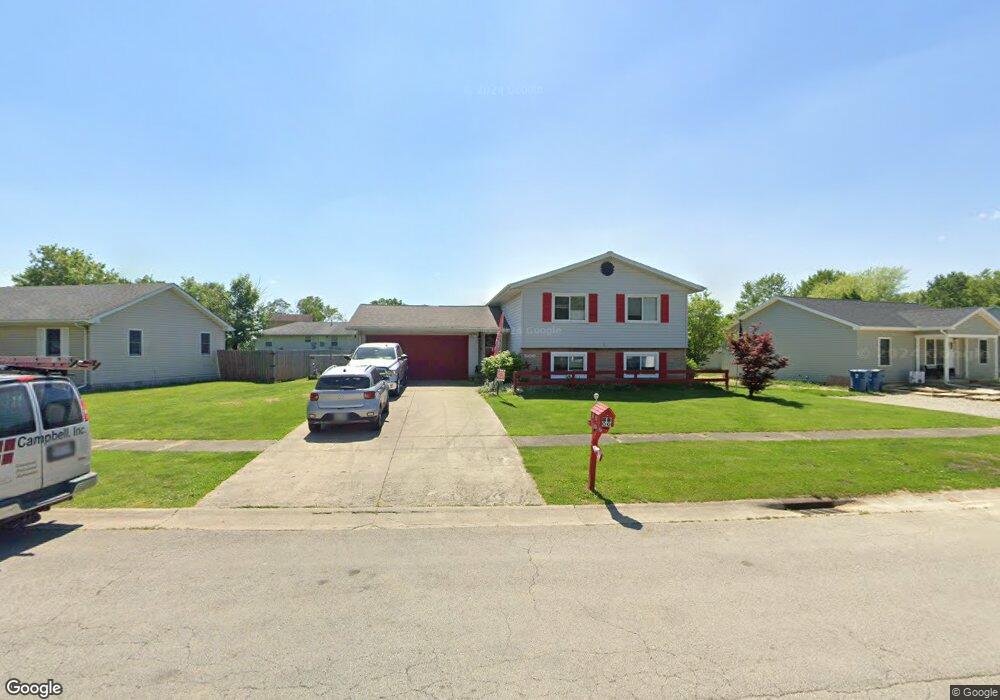
955 Quail Dr Fremont, OH 43420
Estimated Value: $165,000 - $191,969
3
Beds
2
Baths
1,956
Sq Ft
$93/Sq Ft
Est. Value
About This Home
This home is located at 955 Quail Dr, Fremont, OH 43420 and is currently estimated at $181,492, approximately $92 per square foot. 955 Quail Dr is a home located in Sandusky County with nearby schools including Fremont Ross High School, Sacred Heart School, and Bishop Hoffman Catholic School - This is St Joe's School now.
Ownership History
Date
Name
Owned For
Owner Type
Purchase Details
Closed on
Oct 12, 2007
Sold by
Klein Adam T and Klein Haley S
Bought by
Inman Kat E
Current Estimated Value
Home Financials for this Owner
Home Financials are based on the most recent Mortgage that was taken out on this home.
Original Mortgage
$116,176
Outstanding Balance
$73,588
Interest Rate
6.49%
Mortgage Type
FHA
Estimated Equity
$107,904
Purchase Details
Closed on
Feb 20, 2004
Sold by
Pena Joseph L and Pena Karen M
Bought by
Klein Adam T and Klein Haley S
Home Financials for this Owner
Home Financials are based on the most recent Mortgage that was taken out on this home.
Original Mortgage
$105,000
Interest Rate
5.96%
Mortgage Type
Purchase Money Mortgage
Purchase Details
Closed on
Aug 1, 1990
Sold by
Pena Joseph L and Pena Karen M
Bought by
Inman Kai E
Purchase Details
Closed on
Nov 1, 1989
Sold by
Pena Joseph L and Pena Karen M
Bought by
Inman Kai E
Purchase Details
Closed on
Sep 1, 1986
Bought by
Inman Kai E
Create a Home Valuation Report for This Property
The Home Valuation Report is an in-depth analysis detailing your home's value as well as a comparison with similar homes in the area
Home Values in the Area
Average Home Value in this Area
Purchase History
| Date | Buyer | Sale Price | Title Company |
|---|---|---|---|
| Inman Kat E | $88,500 | First American Title | |
| Klein Adam T | $78,750 | Midland Title | |
| Inman Kai E | $66,500 | -- | |
| Inman Kai E | $67,500 | -- | |
| Inman Kai E | $6,000 | -- |
Source: Public Records
Mortgage History
| Date | Status | Borrower | Loan Amount |
|---|---|---|---|
| Open | Inman Kat E | $116,176 | |
| Previous Owner | Klein Adam T | $105,000 |
Source: Public Records
Tax History Compared to Growth
Tax History
| Year | Tax Paid | Tax Assessment Tax Assessment Total Assessment is a certain percentage of the fair market value that is determined by local assessors to be the total taxable value of land and additions on the property. | Land | Improvement |
|---|---|---|---|---|
| 2024 | $1,785 | $49,490 | $8,960 | $40,530 |
| 2023 | $1,745 | $45,020 | $8,160 | $36,860 |
| 2022 | $1,745 | $45,020 | $8,160 | $36,860 |
| 2021 | $1,802 | $45,020 | $8,160 | $36,860 |
| 2020 | $1,450 | $35,670 | $8,160 | $27,510 |
| 2019 | $1,448 | $35,670 | $8,160 | $27,510 |
| 2018 | $1,453 | $35,670 | $8,160 | $27,510 |
| 2017 | $1,456 | $35,670 | $8,160 | $27,510 |
| 2016 | $1,277 | $35,670 | $8,160 | $27,510 |
| 2015 | $1,255 | $35,670 | $8,160 | $27,510 |
| 2014 | $1,314 | $35,600 | $8,720 | $26,880 |
| 2013 | $1,285 | $35,600 | $8,720 | $26,880 |
Source: Public Records
Map
Nearby Homes
- 0 S Buchanan St
- 600 S Buchanan St
- 546 Oaklawn Ave
- 906 Amsden Blvd
- 800 Lawndale Dr
- 314 S Collinwood Blvd
- 309 S Collinwood Blvd
- 1526 Sunrise Blvd
- 714 E State St
- 230 N Pennsylvania Ave
- 515 S Arch St
- 625 Bush Place
- 933 E Cole Rd
- 335 Cottage St
- 208 E State St
- 322 4th St
- 619 Hayes Ave
- 18 Katlyn Dr
- 815 South St
- 905 Twinn St