Estimated Value: $2,676,000 - $4,097,165
4
Beds
3
Baths
2,298
Sq Ft
$1,520/Sq Ft
Est. Value
About This Home
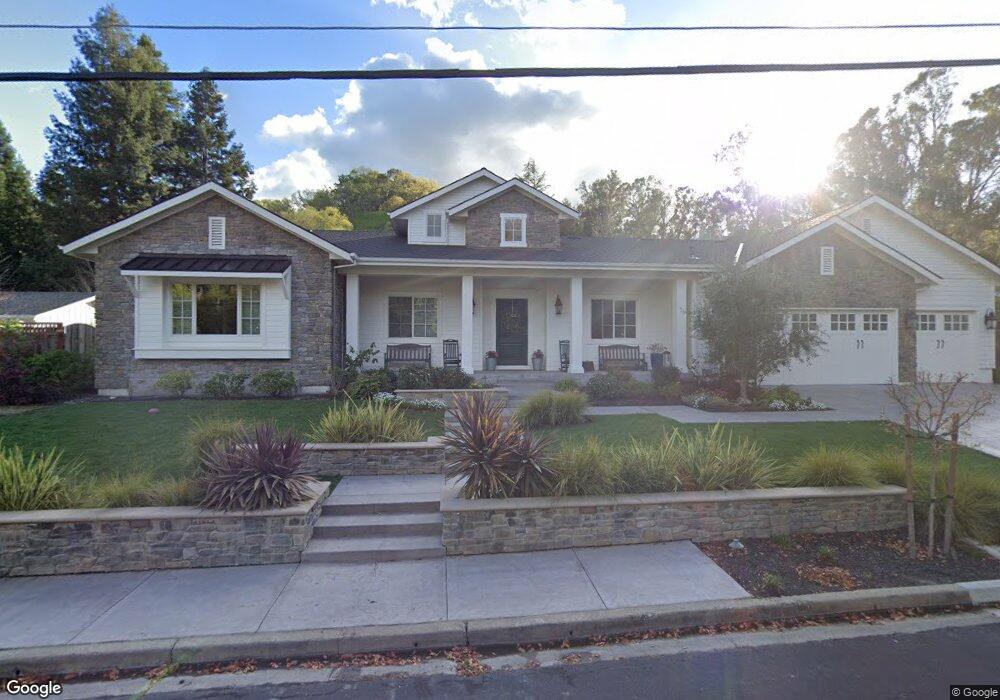
This home is located at 955 Underhill Dr, Alamo, CA 94507 and is currently estimated at $3,494,041, approximately $1,520 per square foot. 955 Underhill Dr is a home located in Contra Costa County with nearby schools including Stone Valley Middle School, San Ramon Valley High School, and San Ramon Valley Christian Academy.
Ownership History
Date
Name
Owned For
Owner Type
Purchase Details
Closed on
Dec 11, 2015
Sold by
Halow James A and Halow Gina L
Bought by
The Halow Family Trust
Current Estimated Value
Purchase Details
Closed on
Mar 15, 2013
Sold by
Tinker Jeff P and Tinker Elisa L
Bought by
Halow James A and Halow Gina L
Purchase Details
Closed on
Mar 11, 2010
Sold by
Tinker Jeff P and Tinker Elisa L
Bought by
Tinker Jeff P and Tinker Elisa L
Home Financials for this Owner
Home Financials are based on the most recent Mortgage that was taken out on this home.
Original Mortgage
$729,500
Interest Rate
4.12%
Mortgage Type
New Conventional
Purchase Details
Closed on
Jun 8, 2005
Sold by
Sosko Donna M
Bought by
Terrell Elisa L and Tinker Jeff P
Home Financials for this Owner
Home Financials are based on the most recent Mortgage that was taken out on this home.
Original Mortgage
$891,000
Interest Rate
5.12%
Mortgage Type
Purchase Money Mortgage
Create a Home Valuation Report for This Property
The Home Valuation Report is an in-depth analysis detailing your home's value as well as a comparison with similar homes in the area
Home Values in the Area
Average Home Value in this Area
Purchase History
| Date | Buyer | Sale Price | Title Company |
|---|---|---|---|
| The Halow Family Trust | -- | None Available | |
| Halow James A | $1,310,000 | Fidelity National Title Co | |
| Tinker Jeff P | -- | Old Republic Title Company | |
| Terrell Elisa L | $1,397,000 | Fidelity National Title |
Source: Public Records
Mortgage History
| Date | Status | Borrower | Loan Amount |
|---|---|---|---|
| Previous Owner | Tinker Jeff P | $729,500 | |
| Previous Owner | Terrell Elisa L | $891,000 |
Source: Public Records
Tax History
| Year | Tax Paid | Tax Assessment Tax Assessment Total Assessment is a certain percentage of the fair market value that is determined by local assessors to be the total taxable value of land and additions on the property. | Land | Improvement |
|---|---|---|---|---|
| 2025 | $29,496 | $2,629,398 | $1,206,793 | $1,422,605 |
| 2024 | $28,473 | $2,577,842 | $1,183,131 | $1,394,711 |
| 2023 | $28,473 | $2,527,297 | $1,159,933 | $1,367,364 |
| 2022 | $28,264 | $2,477,743 | $1,137,190 | $1,340,553 |
| 2021 | $27,672 | $2,429,161 | $1,114,893 | $1,314,268 |
| 2019 | $26,647 | $2,315,413 | $1,081,826 | $1,233,587 |
| 2018 | $25,052 | $2,215,112 | $1,060,614 | $1,154,498 |
| 2017 | $24,149 | $2,171,679 | $1,039,818 | $1,131,861 |
| 2016 | $23,892 | $2,129,098 | $1,019,430 | $1,109,668 |
| 2015 | $23,623 | $2,097,118 | $1,004,118 | $1,093,000 |
| 2014 | $14,804 | $1,282,449 | $984,449 | $298,000 |
Source: Public Records
Map
Nearby Homes
- 950 Escondido Ct
- 104 Muir Ln
- 1015 Ironwood Place
- 11 Xavier Ct
- 348 Del Amigo Rd
- 300 Oak View Terrace
- 700 Clipper Hill Rd
- 4 La Serena Way
- 428 Marian Ln
- 122 Briar Place
- 162 Briar Place
- 230 El Pinto Unit A1
- 0 Lark Ln Unit 41120351
- 1384 Danville Blvd
- 165 Rubicon Cir Unit 17
- 45 Lark Place
- 35 Danville Oak Place
- 315 Garden Creek Place
- 57 Danville Oak Place Unit 57
- 413 Shirlee Dr
- 945 Underhill Dr
- 965 Underhill Dr
- 950 Camille Ln
- 950 Underhill Dr
- 940 Camille Ln
- 940 Underhill Dr
- 960 Underhill Dr
- 935 Underhill Dr
- 930 Camille Ln
- 333 Abbott Ln
- 939 Forest Ln
- 945 Forest Ln
- 925 Underhill Dr
- 951 Forest Ln
- 920 Camille Ln
- 920 Underhill Dr
- 927 Forest Ln
- 915 Underhill Dr
- 957 Forest Ln
- 910 Underhill Dr
Your Personal Tour Guide
Ask me questions while you tour the home.