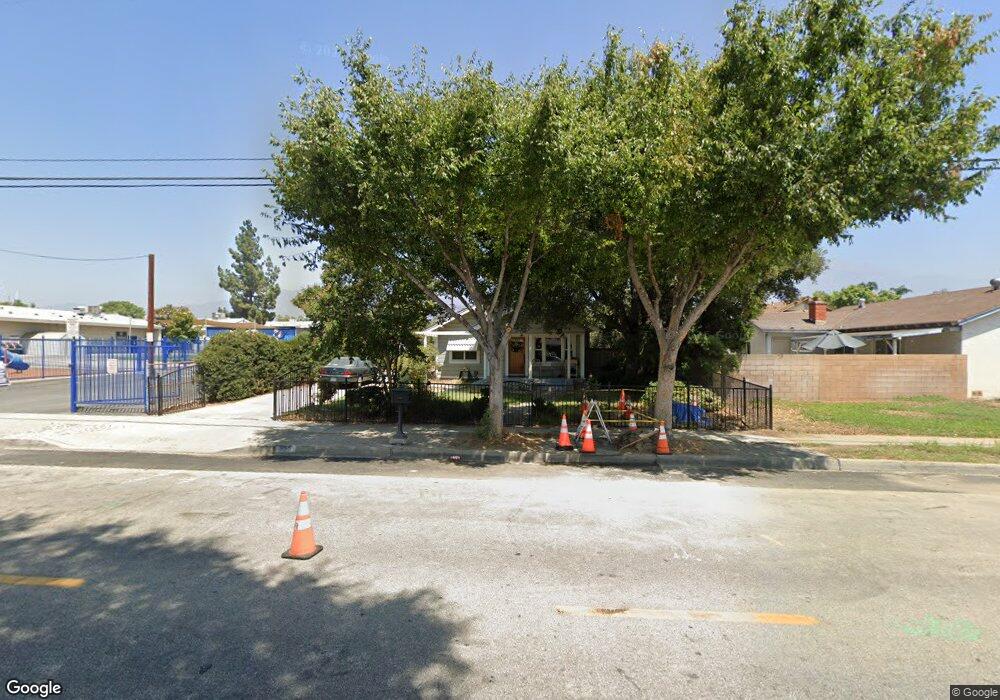
955 W 11th St Upland, CA 91786
Estimated Value: $545,000 - $696,000
2
Beds
1
Bath
820
Sq Ft
$729/Sq Ft
Est. Value
About This Home
This home is located at 955 W 11th St, Upland, CA 91786 and is currently estimated at $597,664, approximately $728 per square foot. 955 W 11th St is a home located in San Bernardino County with nearby schools including Baldy View Elementary School, Upland Junior High School, and Upland High School.
Ownership History
Date
Name
Owned For
Owner Type
Purchase Details
Closed on
Aug 6, 2003
Sold by
Sabala Timothy J
Bought by
Sabala Timothy J and Marlett Leslie K
Current Estimated Value
Home Financials for this Owner
Home Financials are based on the most recent Mortgage that was taken out on this home.
Original Mortgage
$134,105
Outstanding Balance
$57,633
Interest Rate
5.29%
Mortgage Type
FHA
Estimated Equity
$540,031
Purchase Details
Closed on
May 21, 2001
Sold by
Aguiar Nancy L
Bought by
Sabala Timothy J
Home Financials for this Owner
Home Financials are based on the most recent Mortgage that was taken out on this home.
Original Mortgage
$134,105
Interest Rate
7.15%
Mortgage Type
FHA
Purchase Details
Closed on
Nov 7, 1995
Sold by
Nevius Lloyd L
Bought by
Nevius Lloyd L and Nevius Betty E
Purchase Details
Closed on
Dec 3, 1993
Sold by
Nevius Lloyd
Bought by
Nevius Lloyd L and Nevius Betty E
Create a Home Valuation Report for This Property
The Home Valuation Report is an in-depth analysis detailing your home's value as well as a comparison with similar homes in the area
Home Values in the Area
Average Home Value in this Area
Purchase History
We collect this data history from publicly available records. To have your information removed, we recommend requesting removal directly through your county’s website.
| Date | Buyer | Sale Price | Title Company |
|---|---|---|---|
| Sabala Timothy J | -- | Lawyers | |
| Sabala Timothy J | $136,000 | Northern Counties Title | |
| Nevius Lloyd L | -- | -- | |
| Nevius Lloyd L | -- | -- |
Source: Public Records
Mortgage History
We collect this data history from publicly available records. To have your information removed, we recommend requesting removal directly through your county’s website.
| Date | Status | Borrower | Loan Amount |
|---|---|---|---|
| Open | Sabala Timothy J | $134,105 | |
| Previous Owner | Sabala Timothy J | $134,105 |
Source: Public Records
Tax History
| Year | Tax Paid | Tax Assessment Tax Assessment Total Assessment is a certain percentage of the fair market value that is determined by local assessors to be the total taxable value of land and additions on the property. | Land | Improvement |
|---|---|---|---|---|
| 2025 | $2,472 | $200,910 | $70,320 | $130,590 |
| 2024 | $2,213 | $196,970 | $68,941 | $128,029 |
| 2023 | $2,177 | $193,108 | $67,589 | $125,519 |
| 2022 | $2,128 | $189,322 | $66,264 | $123,058 |
| 2021 | $2,121 | $185,610 | $64,965 | $120,645 |
| 2020 | $2,063 | $183,707 | $64,299 | $119,408 |
| 2019 | $2,055 | $180,105 | $63,038 | $117,067 |
| 2018 | $2,006 | $176,574 | $61,802 | $114,772 |
| 2017 | $1,947 | $173,112 | $60,590 | $112,522 |
| 2016 | $1,764 | $169,718 | $59,402 | $110,316 |
| 2015 | $1,723 | $167,169 | $58,510 | $108,659 |
| 2014 | $1,677 | $163,895 | $57,364 | $106,531 |
Source: Public Records
Map
Nearby Homes
- 595 Juniper Ave
- 988 W Arrow Hwy Unit E
- 959 W Pine St Unit 33
- 1049 W Pine St Unit C
- 357 Amber Ct
- 1309 N Albright Ave
- 1182 Mountain Gate Rd
- 910 N Redding Way Unit I
- 1223 Lenwood Square
- 586 Diamond Ct
- 1193 W 13th St
- 579 W 9th St
- 435 W 9th St Unit A6
- 435 W 9th St
- 1376 Omalley Way
- 960 Sheridan St
- 644 Moonstone Ct
- 840 N Euclid Ave
- 1234 N Laurel Ave
- 1487 Florence Ct
- 815 Magnolia Ave
- 805 Magnolia Ave
- 827 Magnolia Ave
- 0 Bay St Unit CRAR25093919
- 0 Bay St Unit AR25093919
- 1180 Alta Vista Ave
- 1617 Mahogany
- 839 Magnolia Ave
- 948 W 11th St
- 938 W 11th St
- 851 Magnolia Ave
- 913 W 11th St
- 44 7th
- 565 N Upland
- 18171 Macintosh Way
- 0 1st Ave Unit CV21208361
- 916 Amber Ct
- 761 Magnolia Ave
- 916 W 11th St
- 905 W 11th St
Your Personal Tour Guide
Ask me questions while you tour the home.