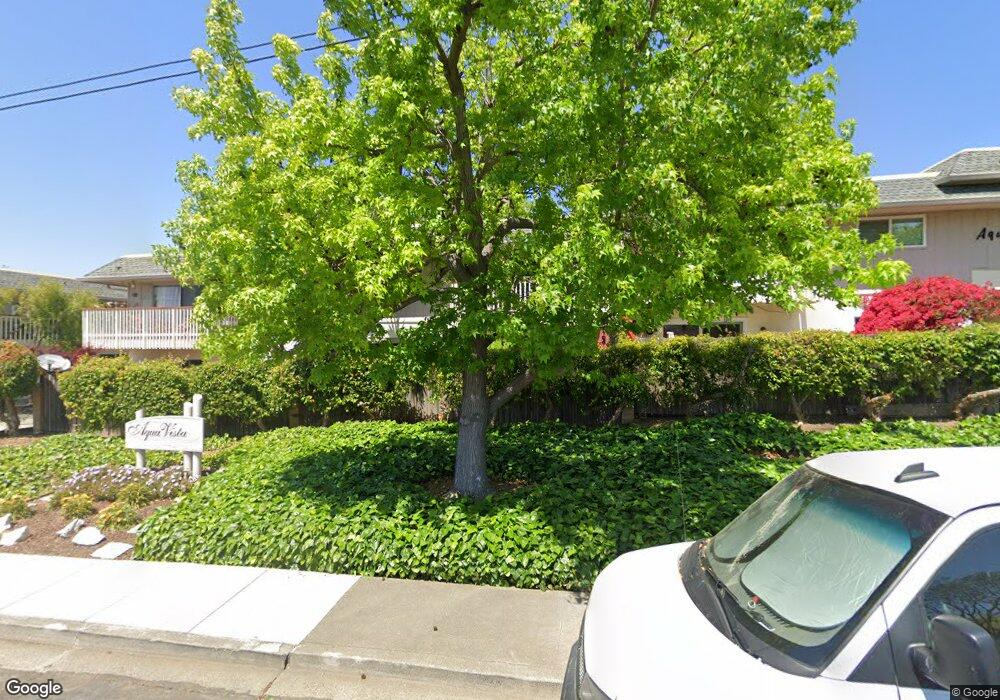
955 W L St Unit 27 Benicia, CA 94510
Estimated Value: $308,963 - $377,000
2
Beds
1
Bath
900
Sq Ft
$382/Sq Ft
Est. Value
About This Home
This home is located at 955 W L St Unit 27, Benicia, CA 94510 and is currently estimated at $343,491, approximately $381 per square foot. 955 W L St Unit 27 is a home located in Solano County with nearby schools including Mary Farmar Elementary School, Benicia Middle School, and Benicia High School.
Ownership History
Date
Name
Owned For
Owner Type
Purchase Details
Closed on
May 15, 2017
Sold by
Wen Zhuoxin and Cal Jinghua
Bought by
Cal Jinghua
Current Estimated Value
Purchase Details
Closed on
Dec 14, 2011
Sold by
Fields Carolyn
Bought by
Wen Zhuoxin and Cai Jinghua
Purchase Details
Closed on
Oct 6, 2006
Sold by
Acker Robert W and Acker Jennifer M
Bought by
Fields Carolyn
Home Financials for this Owner
Home Financials are based on the most recent Mortgage that was taken out on this home.
Original Mortgage
$7,740
Interest Rate
6.44%
Mortgage Type
Unknown
Purchase Details
Closed on
Aug 28, 1997
Sold by
Lindsay David L and Lindsay Ann
Bought by
Acker Robert W
Purchase Details
Closed on
Feb 13, 1997
Sold by
Lindsay David L
Bought by
Lindsay David L and Lindsay Ann
Home Financials for this Owner
Home Financials are based on the most recent Mortgage that was taken out on this home.
Original Mortgage
$58,400
Interest Rate
7.85%
Create a Home Valuation Report for This Property
The Home Valuation Report is an in-depth analysis detailing your home's value as well as a comparison with similar homes in the area
Home Values in the Area
Average Home Value in this Area
Purchase History
| Date | Buyer | Sale Price | Title Company |
|---|---|---|---|
| Cal Jinghua | -- | None Available | |
| Wen Zhuoxin | $65,000 | Fidelity National Title Co | |
| Fields Carolyn | $258,000 | North American Title Co | |
| Acker Robert W | -- | North American Title Co | |
| Lindsay David L | -- | First American Title Guarant |
Source: Public Records
Mortgage History
| Date | Status | Borrower | Loan Amount |
|---|---|---|---|
| Previous Owner | Fields Carolyn | $7,740 | |
| Previous Owner | Fields Carolyn | $250,260 | |
| Previous Owner | Lindsay David L | $58,400 |
Source: Public Records
Tax History Compared to Growth
Tax History
| Year | Tax Paid | Tax Assessment Tax Assessment Total Assessment is a certain percentage of the fair market value that is determined by local assessors to be the total taxable value of land and additions on the property. | Land | Improvement |
|---|---|---|---|---|
| 2025 | $884 | $81,633 | $25,115 | $56,518 |
| 2024 | $884 | $80,033 | $24,623 | $55,410 |
| 2023 | $861 | $78,465 | $24,141 | $54,324 |
| 2022 | $844 | $76,927 | $23,668 | $53,259 |
| 2021 | $825 | $75,419 | $23,204 | $52,215 |
| 2020 | $813 | $74,647 | $22,967 | $51,680 |
| 2019 | $798 | $73,184 | $22,517 | $50,667 |
| 2018 | $776 | $71,750 | $22,076 | $49,674 |
| 2017 | $757 | $70,344 | $21,644 | $48,700 |
| 2016 | $751 | $68,966 | $21,220 | $47,746 |
| 2015 | $731 | $67,931 | $20,902 | $47,029 |
| 2014 | $721 | $66,601 | $20,493 | $46,108 |
Source: Public Records
Map
Nearby Homes
- 919 W L St Unit 15
- 1130 W 9th St
- 1182 W K St
- 900 Southampton Rd Unit 45
- 900 Southampton Rd Unit 110
- 900 Southampton Rd Unit 138
- 1234 Military W
- 15 Buena Vista
- 676 W I St
- 47 Alta Loma
- 1364 Bonita Bahia
- 1352 W K St
- 500 Raymond Dr
- 543 Sandy Way
- 327 Steven Cir
- 1740 Stuart Ct
- 117 Sunset Cir Unit 37
- 117 Sunset Cir Unit 36
- 117 Sunset Cir Unit 34
- 1764 Devonshire Dr
- 955 W L St Unit 25
- 955 W L St Unit 28
- 955 W L St
- 955 W L St
- 955 W L St Unit 24
- 955 W L St Unit 23
- 955 W L St Unit 22
- 955 W L St Unit 21
- 955 W L St Unit 20
- 955 W L St Unit 19
- 919 W L St Unit 4
- 919 W L St Unit 2
- 919 W L St Unit 17
- 919 W L St Unit 7
- 919 W L St Unit 18
- 919 W L St
- 919 W L St Unit 16
- 919 W L St
- 919 W L St
- 919 W L St Unit 12