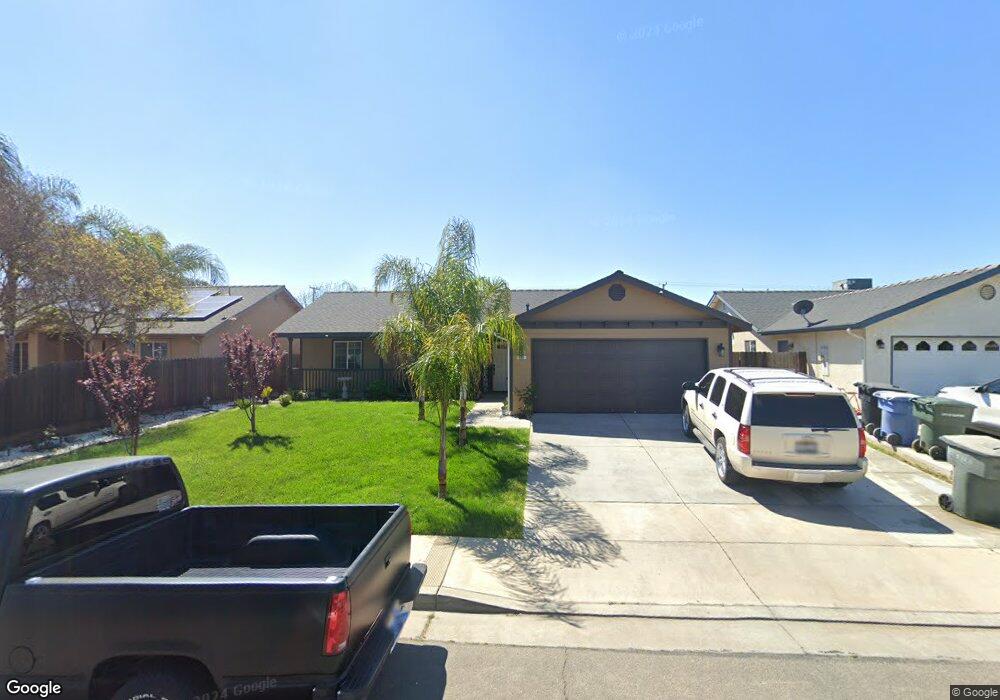
955 W Mammoth Pool Way Hanford, CA 93230
Estimated Value: $285,000 - $332,000
3
Beds
2
Baths
1,271
Sq Ft
$248/Sq Ft
Est. Value
About This Home
This home is located at 955 W Mammoth Pool Way, Hanford, CA 93230 and is currently estimated at $315,176, approximately $247 per square foot. 955 W Mammoth Pool Way is a home located in Kings County with nearby schools including Martin Luther King Jr. Elementary School, John F. Kennedy Junior High School, and Hanford West High School.
Ownership History
Date
Name
Owned For
Owner Type
Purchase Details
Closed on
Mar 12, 2021
Sold by
Sainz Robert C and Sainz Barbara M
Bought by
Fernandez Miguel Angel Villa and Urrutia Maria Maribel
Current Estimated Value
Home Financials for this Owner
Home Financials are based on the most recent Mortgage that was taken out on this home.
Original Mortgage
$198,000
Outstanding Balance
$178,382
Interest Rate
3%
Mortgage Type
New Conventional
Estimated Equity
$136,794
Purchase Details
Closed on
Jul 25, 2005
Sold by
Jacobson Randy L and Jacobson Janice E
Bought by
Sainz Robert C and Sainz Barbara M
Home Financials for this Owner
Home Financials are based on the most recent Mortgage that was taken out on this home.
Original Mortgage
$151,200
Interest Rate
5.56%
Mortgage Type
Fannie Mae Freddie Mac
Purchase Details
Closed on
Feb 22, 2005
Sold by
The Demyan Co
Bought by
Jacobson Randy L and Jacobson Janice E
Create a Home Valuation Report for This Property
The Home Valuation Report is an in-depth analysis detailing your home's value as well as a comparison with similar homes in the area
Home Values in the Area
Average Home Value in this Area
Purchase History
| Date | Buyer | Sale Price | Title Company |
|---|---|---|---|
| Fernandez Miguel Angel Villa | $220,000 | Chicago Title Company | |
| Sainz Robert C | $189,000 | Chicago Title Company | |
| Jacobson Randy L | $93,000 | Chicago Title Company |
Source: Public Records
Mortgage History
| Date | Status | Borrower | Loan Amount |
|---|---|---|---|
| Open | Fernandez Miguel Angel Villa | $198,000 | |
| Previous Owner | Sainz Robert C | $151,200 |
Source: Public Records
Tax History Compared to Growth
Tax History
| Year | Tax Paid | Tax Assessment Tax Assessment Total Assessment is a certain percentage of the fair market value that is determined by local assessors to be the total taxable value of land and additions on the property. | Land | Improvement |
|---|---|---|---|---|
| 2025 | $2,961 | $270,606 | $75,769 | $194,837 |
| 2023 | $2,961 | $260,100 | $72,828 | $187,272 |
| 2022 | $2,901 | $255,000 | $71,400 | $183,600 |
| 2021 | $2,715 | $238,615 | $63,125 | $175,490 |
| 2020 | $2,743 | $236,169 | $62,478 | $173,691 |
| 2019 | $2,287 | $195,000 | $65,000 | $130,000 |
| 2018 | $2,010 | $172,000 | $65,000 | $107,000 |
| 2017 | $1,837 | $159,000 | $65,000 | $94,000 |
| 2016 | $1,671 | $143,325 | $60,000 | $83,325 |
| 2015 | $1,608 | $136,500 | $60,000 | $76,500 |
| 2014 | $1,369 | $115,522 | $30,136 | $85,386 |
Source: Public Records
Map
Nearby Homes
- 1830 S Kerckhoff Way
- 11741 S 11th Ave
- Walden Plan at Live Oak - Hidden Oaks II
- Ashford Plan at Live Oak - Hidden Oaks II
- Kipling Plan at Live Oak - Hidden Oaks II
- Hawthorne Plan at Live Oak - Hidden Oaks II
- Henley Plan at Live Oak - Hidden Oaks II
- 11071 Hume Ave
- 1589 S Barberry Place Unit Ho54
- 1577 S Barberry Place Unit Ho53
- 1857 S Red Rock Dr
- 1518 W Bison Ln Unit Ae 85
- AE 88 W Bison Ln
- 1523 S Autumn Breeze Ct Unit Holl66
- 1485 S Autumn Breeze Ct Unit Ho61
- 1469 S Autumn Breeze Ct Unit Holl59
- 10949 Hume Ave
- Lot 61 1485 S Autumn Breeze Rd
- 10876 Abby Ln
- Lot 77 Ct
- 945 W Mammoth Pool Way
- 965 W Mammoth Pool Way
- 935 W Mammoth Pool Way
- 975 W Mammoth Pool Way
- 956 W Mammoth Pool Way
- 925 W Mammoth Pool Way
- 966 W Mammoth Pool Way
- 946 W Mammoth Pool Way
- 976 W Mammoth Pool Way
- 936 W Mammoth Pool Way
- 915 W Mammoth Pool Way
- 926 W Mammoth Pool Way
- 995 W Mammoth Pool Way
- 1944 S Kerckhoff Way
- 1942 S Kerckhoff Way
- 916 W Mammoth Pool Way
- 1947 S Wishon Ave
- 1943 S Kerckhoff Way
- 1970 S Wishon Ave
- 1946 S Courtright Ave