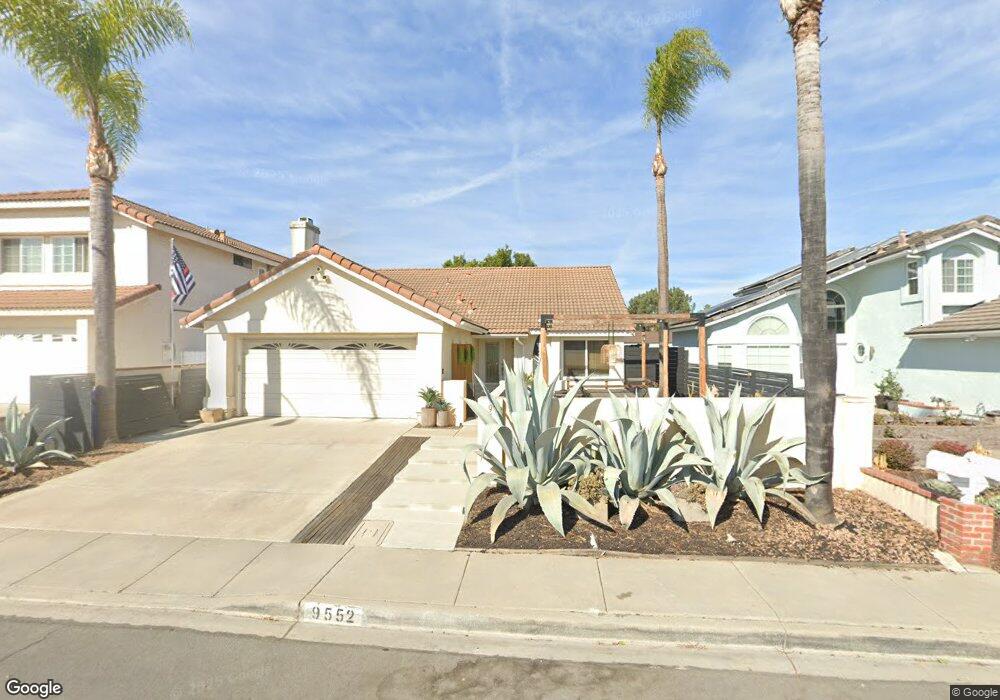
9552 Pipilo St San Diego, CA 92129
Rancho Peñasquitos NeighborhoodEstimated Value: $1,152,000 - $1,366,000
3
Beds
2
Baths
1,403
Sq Ft
$874/Sq Ft
Est. Value
About This Home
This home is located at 9552 Pipilo St, San Diego, CA 92129 and is currently estimated at $1,225,610, approximately $873 per square foot. 9552 Pipilo St is a home located in San Diego County with nearby schools including Canyon View Elementary School, Mesa Verde Middle School, and Westview High School.
Ownership History
Date
Name
Owned For
Owner Type
Purchase Details
Closed on
Jun 3, 2009
Sold by
Meyer William J and Meyer Kathy A
Bought by
Miller Kevin and Miller Caroline
Current Estimated Value
Home Financials for this Owner
Home Financials are based on the most recent Mortgage that was taken out on this home.
Original Mortgage
$408,465
Outstanding Balance
$258,908
Interest Rate
4.83%
Mortgage Type
FHA
Estimated Equity
$966,702
Purchase Details
Closed on
Aug 29, 2005
Sold by
Ostrye Madonna P
Bought by
Meyer William J and Meyer Kathy A
Home Financials for this Owner
Home Financials are based on the most recent Mortgage that was taken out on this home.
Original Mortgage
$402,500
Interest Rate
4.77%
Mortgage Type
Fannie Mae Freddie Mac
Purchase Details
Closed on
Jun 3, 1998
Sold by
Gottesburen Inge D
Bought by
Ostrye Madonna P
Home Financials for this Owner
Home Financials are based on the most recent Mortgage that was taken out on this home.
Original Mortgage
$190,000
Interest Rate
7.11%
Purchase Details
Closed on
Sep 28, 1987
Create a Home Valuation Report for This Property
The Home Valuation Report is an in-depth analysis detailing your home's value as well as a comparison with similar homes in the area
Home Values in the Area
Average Home Value in this Area
Purchase History
| Date | Buyer | Sale Price | Title Company |
|---|---|---|---|
| Miller Kevin | $416,000 | Chicago Title Company | |
| Meyer William J | $575,000 | Southland Title | |
| Ostrye Madonna P | $215,000 | California Title Company | |
| -- | $146,500 | -- |
Source: Public Records
Mortgage History
| Date | Status | Borrower | Loan Amount |
|---|---|---|---|
| Open | Miller Kevin | $408,465 | |
| Previous Owner | Meyer William J | $402,500 | |
| Previous Owner | Ostrye Madonna P | $190,000 |
Source: Public Records
Tax History Compared to Growth
Tax History
| Year | Tax Paid | Tax Assessment Tax Assessment Total Assessment is a certain percentage of the fair market value that is determined by local assessors to be the total taxable value of land and additions on the property. | Land | Improvement |
|---|---|---|---|---|
| 2025 | $6,364 | $577,757 | $278,657 | $299,100 |
| 2024 | $6,364 | $566,430 | $273,194 | $293,236 |
| 2023 | $6,228 | $555,325 | $267,838 | $287,487 |
| 2022 | $6,123 | $544,437 | $262,587 | $281,850 |
| 2021 | $6,043 | $533,763 | $257,439 | $276,324 |
| 2020 | $5,959 | $528,291 | $254,800 | $273,491 |
| 2019 | $5,800 | $517,933 | $249,804 | $268,129 |
| 2018 | $5,632 | $507,778 | $244,906 | $262,872 |
| 2017 | $5,478 | $497,822 | $240,104 | $257,718 |
| 2016 | $5,364 | $488,062 | $235,397 | $252,665 |
| 2015 | $5,281 | $480,732 | $231,862 | $248,870 |
| 2014 | $4,778 | $437,002 | $227,321 | $209,681 |
Source: Public Records
Map
Nearby Homes
- 9525 Vervain St
- 9446 Pipilo St
- 13202 Salmon River Rd Unit 101
- 9458 Twin Trails Dr Unit 205
- 9342 Twin Trails Dr Unit 303
- 13292 Salmon River Rd Unit 204
- 9302 Twin Trails Dr Unit 204
- 12727 Calle de Las Rosas
- 9720 Graceland Way
- 9525 High Park Ln
- 13411 Appalachian Way
- 9488 Hiker Hill Rd
- 13445 Appalachian Way
- 13640 Via Cima Bella
- 12776 Isocoma St Unit 4
- 13045 Texana St
- 9555 Via Pereza
- 12940 Calle de Las Rosas
- 12979 Calle de Las Rosas
- 9068 Buckwheat St
- 9546 Pipilo St
- 9564 Pipilo St
- 9540 Pipilo St
- 9570 Pipilo St
- 9534 Pipilo St
- 9551 Pipilo St
- 9557 Pipilo St
- 9545 Pipilo St
- 9563 Pipilo St
- 9576 Pipilo St
- 9539 Pipilo St
- 9571 Pipilo St
- 9528 Pipilo St
- 9533 Pipilo St
- 9575 Pipilo St
- 9582 Pipilo St
- 9522 Pipilo St
- 9527 Pipilo St
- 9534 Vervain St
- 9542 Vervain St