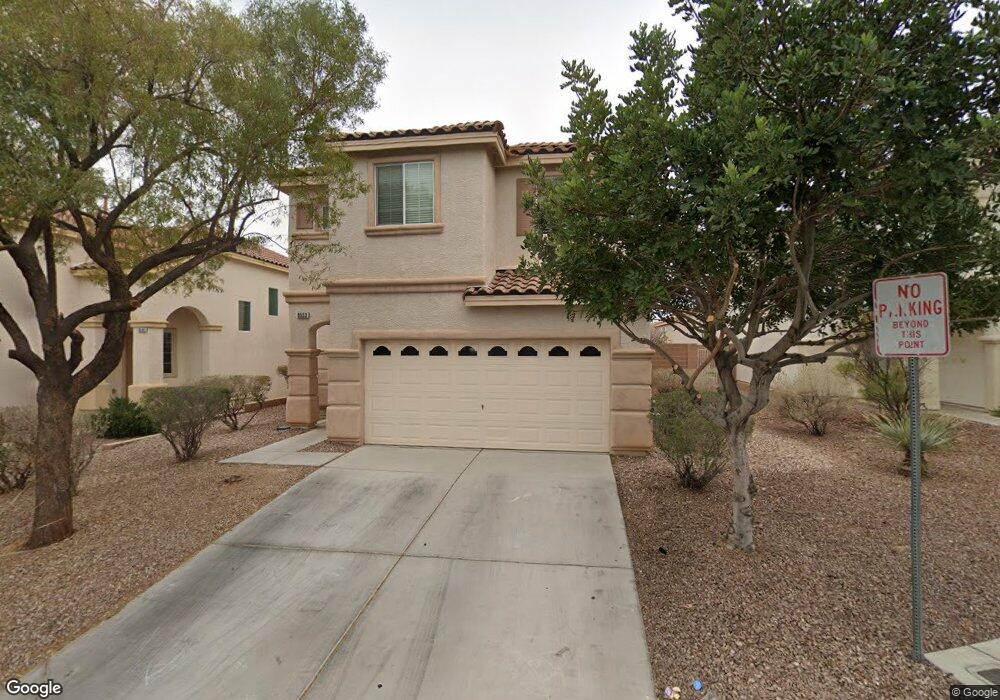
9553 Perennial View Ave Las Vegas, NV 89148
Estimated Value: $486,743 - $521,000
4
Beds
3
Baths
2,144
Sq Ft
$237/Sq Ft
Est. Value
About This Home
This home is located at 9553 Perennial View Ave, Las Vegas, NV 89148 and is currently estimated at $507,936, approximately $236 per square foot. 9553 Perennial View Ave is a home located in Clark County with nearby schools including Kathy L. Batterman Elementary School, Victoria Fertitta Middle School, and Sierra Vista High School.
Ownership History
Date
Name
Owned For
Owner Type
Purchase Details
Closed on
Mar 22, 2022
Sold by
Abraham Adam A
Bought by
Abraham Adam A and Abraham Ann Celina
Current Estimated Value
Purchase Details
Closed on
Aug 15, 2018
Sold by
Souza Jacob D and Souza Christine D
Bought by
Ash Joseph John
Home Financials for this Owner
Home Financials are based on the most recent Mortgage that was taken out on this home.
Original Mortgage
$256,000
Interest Rate
4.5%
Mortgage Type
New Conventional
Purchase Details
Closed on
Aug 11, 2014
Sold by
Souza Jacob D and Souza Christine D D
Bought by
The Jacob And Christine D Souza Family T
Purchase Details
Closed on
Dec 2, 2002
Sold by
Mth Homes Nevada Inc
Bought by
Dsouza Jacob D and Dsouza Christine D
Home Financials for this Owner
Home Financials are based on the most recent Mortgage that was taken out on this home.
Original Mortgage
$154,600
Interest Rate
6.28%
Create a Home Valuation Report for This Property
The Home Valuation Report is an in-depth analysis detailing your home's value as well as a comparison with similar homes in the area
Home Values in the Area
Average Home Value in this Area
Purchase History
| Date | Buyer | Sale Price | Title Company |
|---|---|---|---|
| Abraham Adam A | -- | Vaccarino Law Office | |
| Ash Joseph John | $320,000 | Chicago Title Las Vegas | |
| The Jacob And Christine D Souza Family T | -- | None Available | |
| Dsouza Jacob D | $193,289 | Stewart Title |
Source: Public Records
Mortgage History
| Date | Status | Borrower | Loan Amount |
|---|---|---|---|
| Previous Owner | Ash Joseph John | $256,000 | |
| Previous Owner | Dsouza Jacob D | $154,600 |
Source: Public Records
Tax History Compared to Growth
Tax History
| Year | Tax Paid | Tax Assessment Tax Assessment Total Assessment is a certain percentage of the fair market value that is determined by local assessors to be the total taxable value of land and additions on the property. | Land | Improvement |
|---|---|---|---|---|
| 2025 | $2,418 | $123,644 | $43,400 | $80,244 |
| 2024 | $2,348 | $123,644 | $43,400 | $80,244 |
| 2023 | $2,348 | $112,541 | $36,750 | $75,791 |
| 2022 | $2,402 | $99,584 | $30,450 | $69,134 |
| 2021 | $2,213 | $93,658 | $28,000 | $65,658 |
| 2020 | $2,052 | $93,760 | $28,700 | $65,060 |
| 2019 | $1,923 | $89,242 | $25,200 | $64,042 |
| 2018 | $1,835 | $80,444 | $19,250 | $61,194 |
| 2017 | $2,370 | $80,441 | $18,900 | $61,541 |
| 2016 | $1,718 | $76,076 | $14,700 | $61,376 |
| 2015 | $1,714 | $73,407 | $12,950 | $60,457 |
| 2014 | $1,661 | $54,147 | $8,750 | $45,397 |
Source: Public Records
Map
Nearby Homes
- 9580 Magnificent Ave
- 9496 Magnificent Ave Unit 10
- 9460 Magnificent Ave
- 5886 Pastel Colors St
- 9691 Loud Water Way
- 5831 Sleepy Willow St
- 5697 Tapestry Rose Ct
- 9294 W Oquendo Rd
- 5554 Chicory Falls Ct
- 9289 Mandeville Bay Ave
- 9750 Maple Sugar Leaf Place
- 9286 W Oquendo Rd
- 9282 W Oquendo Rd
- 9238 Stonewall Ridge Ct
- 5927 Villa Loma St
- Plan 1803 Interior Unit at Chelsea
- Plan 1895 End Unit at Chelsea
- Plan 1672 Interior Unit at Chelsea
- Plan 1201 End Unit at Chelsea
- Plan 1201 End Unit Modeled at Chelsea
- 9545 Perennial View Ave
- 9545 Perennial View Ave
- 9545 Perennial View Ave
- 9545 Perennial View Ave
- 9561 Perennial View Ave
- 9537 Perennial View Ave
- 9552 Green Vineyard Ave
- 9544 Green Vineyard Ave
- 9560 Green Vineyard Ave
- 5816 Purple Haze St
- 9529 Perennial View Ave
- 9536 Green Vineyard Ave
- 5808 Purple Haze St Unit 10
- 5824 Purple Haze St
- 9566 Green Vineyard Ave Unit 10
- 5800 Purple Haze St
- 9528 Green Vineyard Ave
- 9521 Perennial View Ave
- 9572 Green Vineyard Ave
- 9520 Green Vineyard Ave