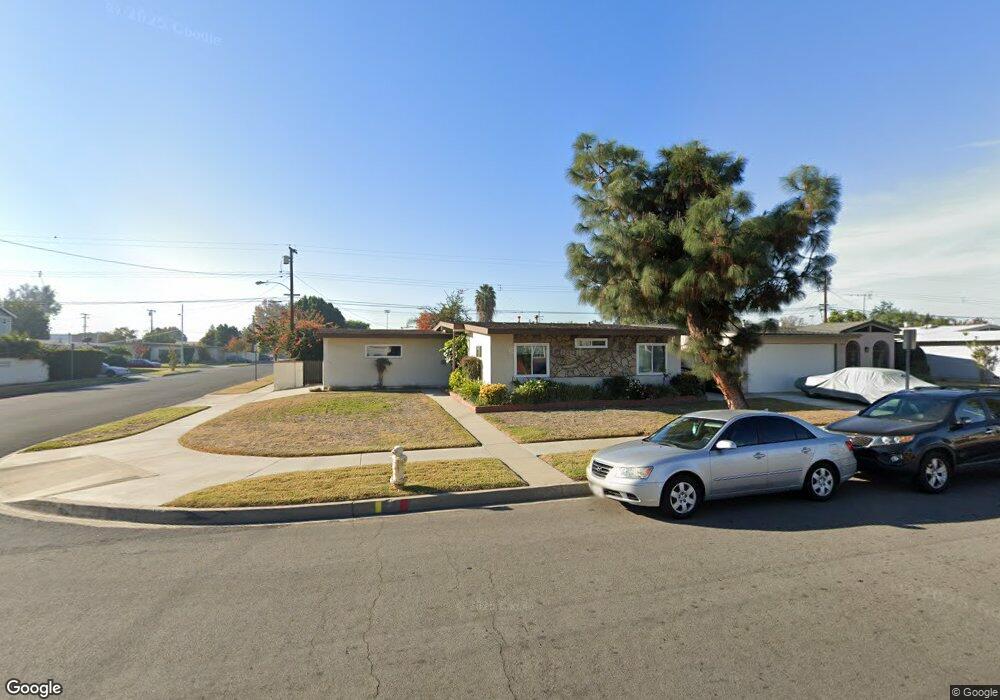
9554 Myron St Pico Rivera, CA 90660
Estimated Value: $712,000 - $802,000
3
Beds
2
Baths
1,233
Sq Ft
$605/Sq Ft
Est. Value
About This Home
This home is located at 9554 Myron St, Pico Rivera, CA 90660 and is currently estimated at $746,188, approximately $605 per square foot. 9554 Myron St is a home located in Los Angeles County with nearby schools including Birney Tech Academy, The STEAM Academy @ Burke, and El Rancho High School.
Ownership History
Date
Name
Owned For
Owner Type
Purchase Details
Closed on
Jul 14, 1998
Sold by
Stark Trina L and The Trina L Stark Trust
Bought by
Stark Trina Lou
Current Estimated Value
Home Financials for this Owner
Home Financials are based on the most recent Mortgage that was taken out on this home.
Original Mortgage
$121,677
Outstanding Balance
$24,025
Interest Rate
6.9%
Mortgage Type
FHA
Estimated Equity
$722,163
Purchase Details
Closed on
Aug 22, 1995
Sold by
Stark Trina L
Bought by
Stark Trina L and Trina L Stark Trust
Purchase Details
Closed on
Mar 15, 1995
Sold by
Stark Trina L and Ramona E Nortvedt Revocable 19
Bought by
Stark Trina L
Create a Home Valuation Report for This Property
The Home Valuation Report is an in-depth analysis detailing your home's value as well as a comparison with similar homes in the area
Home Values in the Area
Average Home Value in this Area
Purchase History
| Date | Buyer | Sale Price | Title Company |
|---|---|---|---|
| Stark Trina Lou | -- | American Title Co | |
| Stark Trina L | -- | -- | |
| Stark Trina L | -- | -- |
Source: Public Records
Mortgage History
| Date | Status | Borrower | Loan Amount |
|---|---|---|---|
| Open | Stark Trina Lou | $121,677 |
Source: Public Records
Tax History Compared to Growth
Tax History
| Year | Tax Paid | Tax Assessment Tax Assessment Total Assessment is a certain percentage of the fair market value that is determined by local assessors to be the total taxable value of land and additions on the property. | Land | Improvement |
|---|---|---|---|---|
| 2025 | $1,844 | $68,900 | $27,909 | $40,991 |
| 2024 | $1,844 | $67,550 | $27,362 | $40,188 |
| 2023 | $8,048 | $592,819 | $416,160 | $176,659 |
| 2022 | $7,681 | $581,196 | $408,000 | $173,196 |
| 2021 | $1,521 | $63,656 | $25,785 | $37,871 |
| 2020 | $1,520 | $63,004 | $25,521 | $37,483 |
| 2019 | $1,491 | $61,770 | $25,021 | $36,749 |
| 2018 | $1,314 | $60,560 | $24,531 | $36,029 |
| 2016 | $1,202 | $58,210 | $23,579 | $34,631 |
| 2015 | $1,186 | $57,336 | $23,225 | $34,111 |
| 2014 | $1,181 | $56,214 | $22,771 | $33,443 |
Source: Public Records
Map
Nearby Homes
- 9729 Homestead St
- 8216 Chaney Ave
- 8328 Buhman Ave
- 7558 Citronell Ave
- 9950 La Docena Ln
- 9602 Florpark St
- 9632 Abbotsford Rd
- 8736 Klinedale Ave
- 8414 Cravell Ave
- 9213 Call St
- 9311 Claymore St
- 9004 Caddy St
- 9512 Nan St
- 8339 Manzanar Ave
- 8826 Bermudez St
- 8849 Pico Vista Rd
- 9208 Canford St
- 8431 Morrill Ave
- 7019 Passons Blvd
- 9636 Cedartree Rd