Estimated Value: $627,000 - $662,632
5
Beds
3
Baths
1,554
Sq Ft
$415/Sq Ft
Est. Value
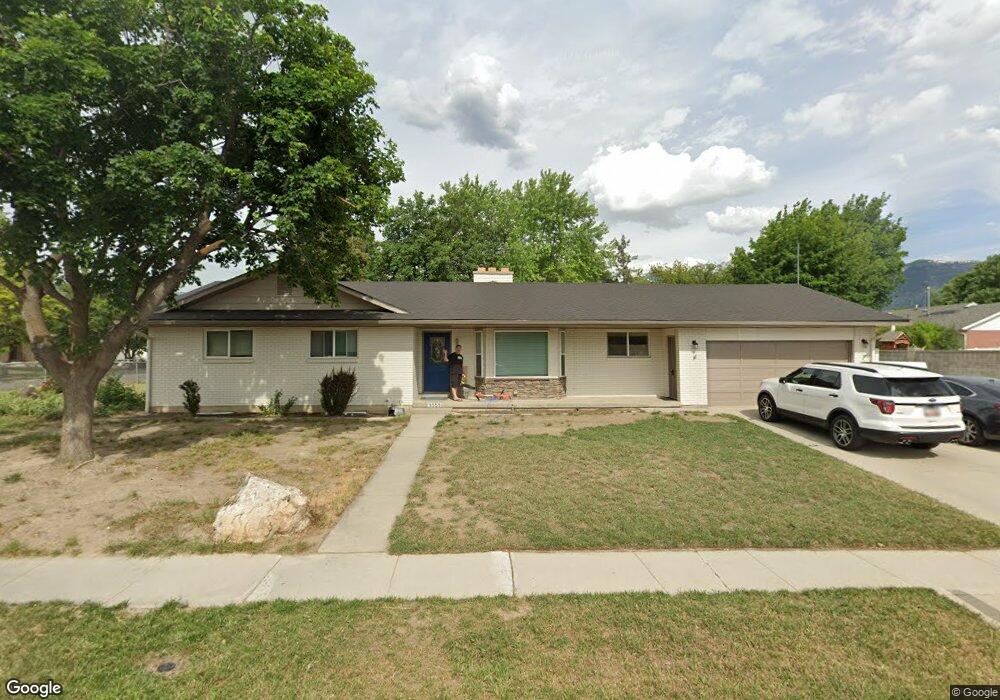
About This Home
This home is located at 9559 David St, Sandy, UT 84070 and is currently estimated at $645,658, approximately $415 per square foot. 9559 David St is a home located in Salt Lake County with nearby schools including Mount Jordan Middle School and Jordan High.
Ownership History
Date
Name
Owned For
Owner Type
Purchase Details
Closed on
Sep 7, 2008
Sold by
Folkersen Rod J
Bought by
9559 David Street Llc
Current Estimated Value
Purchase Details
Closed on
Jun 14, 2007
Sold by
Folkersen Rod
Bought by
Folkersen Rod J and R J Folkersen Family Trust
Purchase Details
Closed on
Jun 13, 2007
Sold by
Martin Bruce E and Martin Koelle H
Bought by
Folkersen Rod
Purchase Details
Closed on
Apr 21, 1993
Sold by
Simonson Leonard
Bought by
Visser Lucas R and Visser Sharon W
Create a Home Valuation Report for This Property
The Home Valuation Report is an in-depth analysis detailing your home's value as well as a comparison with similar homes in the area
Home Values in the Area
Average Home Value in this Area
Purchase History
| Date | Buyer | Sale Price | Title Company |
|---|---|---|---|
| 9559 David Street Llc | -- | Title West | |
| Folkersen Rod J | -- | United Title Services | |
| Folkersen Rod | -- | United Title Services | |
| Visser Lucas R | -- | -- |
Source: Public Records
Tax History
| Year | Tax Paid | Tax Assessment Tax Assessment Total Assessment is a certain percentage of the fair market value that is determined by local assessors to be the total taxable value of land and additions on the property. | Land | Improvement |
|---|---|---|---|---|
| 2025 | $3,299 | $628,300 | $205,800 | $422,500 |
| 2024 | $3,299 | $610,100 | $200,200 | $409,900 |
| 2023 | $2,906 | $535,900 | $189,000 | $346,900 |
| 2022 | $3,065 | $552,100 | $121,800 | $430,300 |
| 2021 | $2,752 | $422,000 | $93,500 | $328,500 |
| 2020 | $2,631 | $380,400 | $93,500 | $286,900 |
| 2019 | $2,483 | $349,900 | $88,200 | $261,700 |
| 2016 | $2,160 | $292,700 | $88,200 | $204,500 |
Source: Public Records
Map
Nearby Homes
- 186 Brent Cir
- 487 E 9270 S
- 566 E 9270 S
- 9822 S Darin Dr
- 362 E 9150 S
- 181 E 9180 S
- 9218 S Laura Anne Way
- 807 E Whisper Cove Rd
- 37 Crawford Place
- 9092 Enchanted Oak Ln
- 10106 S Peony Way
- 8750 S 500 E
- 8812 S Cy's Park Ln Unit 6
- 8807 S Cy's Park Ln E Unit 1
- 8806 S Cy's Park Ln E Unit 4
- 8808 S Cy's Park Unit 5
- 9101 S Enchanted Oak Ln
- 8475 S State St
- 918 Lazon Dr
- 165 Albion Village Way Unit 303
Your Personal Tour Guide
Ask me questions while you tour the home.