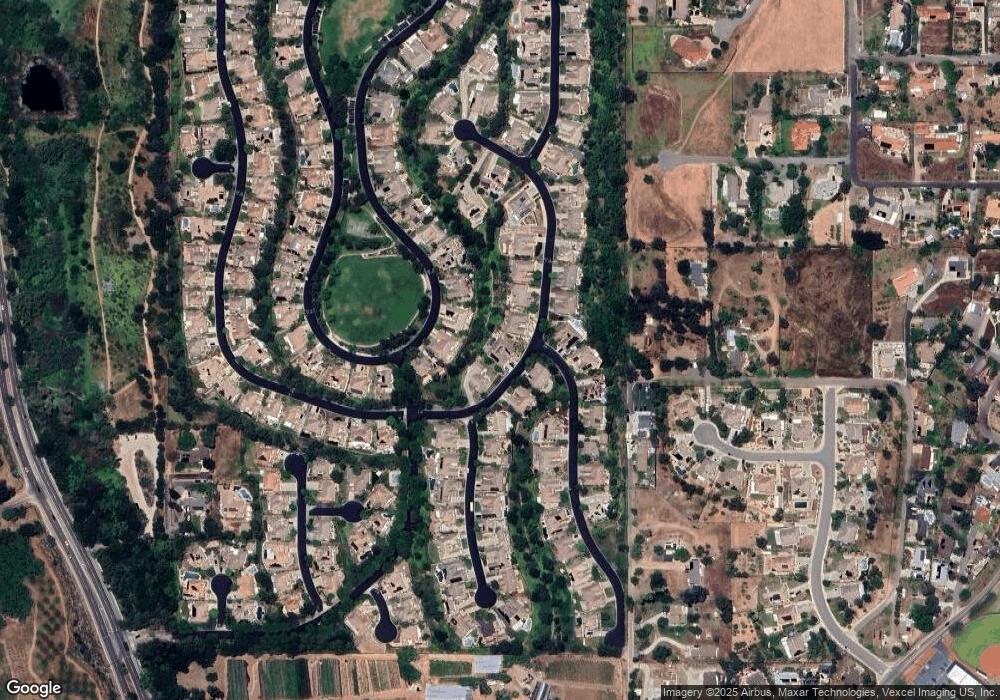
956 Inverlochy Dr Fallbrook, CA 92028
Estimated Value: $1,134,000 - $1,189,000
4
Beds
4
Baths
3,278
Sq Ft
$356/Sq Ft
Est. Value
About This Home
This home is located at 956 Inverlochy Dr, Fallbrook, CA 92028 and is currently estimated at $1,166,646, approximately $355 per square foot. 956 Inverlochy Dr is a home located in San Diego County with nearby schools including Live Oak Elementary School, James E. Potter Intermediate School, and Fallbrook High School.
Ownership History
Date
Name
Owned For
Owner Type
Purchase Details
Closed on
Apr 18, 2000
Sold by
L M D Fallbrook L L C
Bought by
Lafay Richard J and Lafay Mara L
Current Estimated Value
Home Financials for this Owner
Home Financials are based on the most recent Mortgage that was taken out on this home.
Original Mortgage
$280,700
Outstanding Balance
$92,843
Interest Rate
7.75%
Estimated Equity
$1,073,803
Create a Home Valuation Report for This Property
The Home Valuation Report is an in-depth analysis detailing your home's value as well as a comparison with similar homes in the area
Home Values in the Area
Average Home Value in this Area
Purchase History
| Date | Buyer | Sale Price | Title Company |
|---|---|---|---|
| Lafay Richard J | $351,000 | First American Title |
Source: Public Records
Mortgage History
| Date | Status | Borrower | Loan Amount |
|---|---|---|---|
| Open | Lafay Richard J | $280,700 |
Source: Public Records
Tax History
| Year | Tax Paid | Tax Assessment Tax Assessment Total Assessment is a certain percentage of the fair market value that is determined by local assessors to be the total taxable value of land and additions on the property. | Land | Improvement |
|---|---|---|---|---|
| 2025 | $5,945 | $571,734 | $99,892 | $471,842 |
| 2024 | $5,945 | $560,525 | $97,934 | $462,591 |
| 2023 | $5,769 | $549,535 | $96,014 | $453,521 |
| 2022 | $5,770 | $538,761 | $94,132 | $444,629 |
| 2021 | $5,579 | $528,198 | $92,287 | $435,911 |
| 2020 | $5,625 | $522,783 | $91,341 | $431,442 |
| 2019 | $5,515 | $512,533 | $89,550 | $422,983 |
| 2018 | $5,431 | $502,485 | $87,795 | $414,690 |
| 2017 | $751 | $492,633 | $86,074 | $406,559 |
| 2016 | $5,189 | $482,975 | $84,387 | $398,588 |
| 2015 | $5,099 | $475,721 | $83,120 | $392,601 |
| 2014 | $5,000 | $466,403 | $81,492 | $384,911 |
Source: Public Records
Map
Nearby Homes
- 2116 Kirkcaldy Rd
- 789 Glenhart Place
- 1089 Inverlochy Dr
- 1765 Armadale Rd
- 2104 Reineman Rd
- 1630 S Mission Rd
- 569 Inverlochy Dr
- 2445 S Stage Coach Ln
- 2715 S Mission Rd
- 2327 Clearcrest Ln
- 0 Camino de Nog
- 0 Winter Haven Rd Unit 41
- 0 Mission Rd Unit None
- 0 Mission Rd Unit IG25148608
- 0 Mission Rd Unit NDP2506959
- 1638 Calavo Rd Unit 63
- 190 Mission Oaks Rd
- 1735 S Mission Rd
- 588 Twin Country Ln
- 0 Laurine Ln
- 1020 Inverlochy Dr
- 934 Inverlochy Dr
- 967 Inverlochy Dr
- 945 Inverlochy Dr
- 955 Highland Park
- 933 Highland Park
- 1032 Inverlochy Dr
- 2110 Berwick Wds
- 2110 Berwick Woods
- 2104 Kirkcaldy Rd
- 915 Highland Park
- 969 Highland Park
- 1044 Inverlochy Dr
- 2157 Berwick Woods
- 1019 Inverlochy Dr
- 2103 Kirkcaldy Rd
- 2126 Berwick Woods
- 2142 Berwick Woods
- 1009 Highland Park
- 857 Highland Park
Your Personal Tour Guide
Ask me questions while you tour the home.
