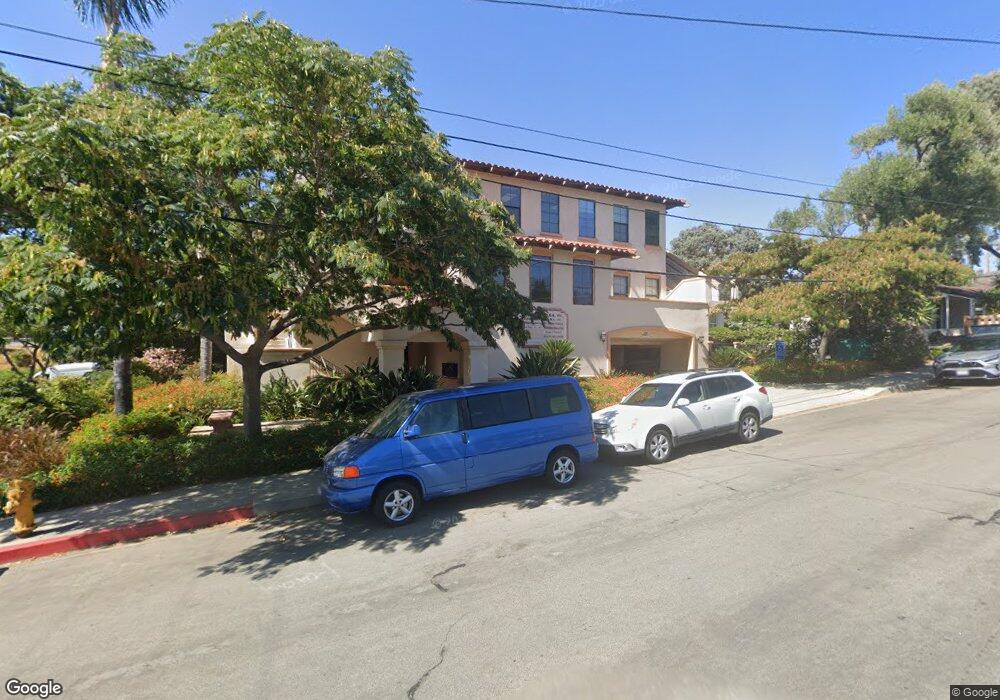
956 Walnut St San Luis Obispo, CA 93401
Downtown San Luis Obispo Neighborhood
--
Bed
1
Bath
8,708
Sq Ft
0.34
Acres
About This Home
This home is located at 956 Walnut St, San Luis Obispo, CA 93401. 956 Walnut St is a home located in San Luis Obispo County with nearby schools including Laguna Middle School, San Luis Obispo High School, and San Luis Obispo Classical Academy.
Ownership History
Date
Name
Owned For
Owner Type
Purchase Details
Closed on
Jun 26, 2002
Sold by
Scarry David and Scarry Maridy Jill
Bought by
Scarry David C and Scarry Maridy Jill
Home Financials for this Owner
Home Financials are based on the most recent Mortgage that was taken out on this home.
Original Mortgage
$1,005,000
Outstanding Balance
$430,568
Interest Rate
6.86%
Mortgage Type
Construction
Purchase Details
Closed on
Mar 28, 2002
Sold by
Scarry David and Scarry Maridy Jill
Bought by
Scarry David C and Scarry Maridy Jill
Purchase Details
Closed on
Mar 30, 1995
Sold by
Nielsen Harald N and Nielsen Helga
Bought by
Scarry David and Scarry Maridy Jill
Home Financials for this Owner
Home Financials are based on the most recent Mortgage that was taken out on this home.
Original Mortgage
$50,000
Interest Rate
8.77%
Create a Home Valuation Report for This Property
The Home Valuation Report is an in-depth analysis detailing your home's value as well as a comparison with similar homes in the area
Home Values in the Area
Average Home Value in this Area
Purchase History
| Date | Buyer | Sale Price | Title Company |
|---|---|---|---|
| Scarry David C | -- | Fidelity National Title Co | |
| Scarry David | -- | Fidelity National Title Co | |
| Scarry David C | -- | -- | |
| Scarry David | $185,000 | First American Title Insuran |
Source: Public Records
Mortgage History
| Date | Status | Borrower | Loan Amount |
|---|---|---|---|
| Open | Scarry David | $1,005,000 | |
| Closed | Scarry David | $50,000 |
Source: Public Records
Tax History Compared to Growth
Tax History
| Year | Tax Paid | Tax Assessment Tax Assessment Total Assessment is a certain percentage of the fair market value that is determined by local assessors to be the total taxable value of land and additions on the property. | Land | Improvement |
|---|---|---|---|---|
| 2025 | $14,738 | $1,360,204 | $273,960 | $1,086,244 |
| 2024 | $14,471 | $1,333,535 | $268,589 | $1,064,946 |
| 2023 | $14,471 | $1,307,388 | $263,323 | $1,044,065 |
| 2022 | $13,564 | $1,281,754 | $258,160 | $1,023,594 |
| 2021 | $13,348 | $1,256,623 | $253,099 | $1,003,524 |
| 2020 | $13,212 | $1,243,739 | $250,504 | $993,235 |
| 2019 | $13,075 | $1,219,353 | $245,593 | $973,760 |
| 2018 | $12,818 | $1,195,445 | $240,778 | $954,667 |
| 2017 | $12,567 | $1,172,006 | $236,057 | $935,949 |
| 2016 | $12,320 | $1,149,027 | $231,429 | $917,598 |
| 2015 | $12,132 | $1,131,768 | $227,953 | $903,815 |
| 2014 | $11,140 | $1,109,599 | $223,488 | $886,111 |
Source: Public Records
Map
Nearby Homes
- 879 Walnut St
- 670 Chorro St Unit D
- 680 Chorro St Unit 5
- 680 Chorro St Unit 18
- 1143 Walnut St
- 783 Toro St
- 787 Toro St
- 570 Peach St Unit 25
- 1214 Mill St
- 3816 Hatchery Ln Unit 1
- 1229 Mill St
- 551 Hathway Ave
- 680 Howard St
- 879 Johnson Ave
- 1318 Mill St
- 1213 Murray Ave
- 973 Higuera St
- 160 Broad St
- 581 Higuera St Unit 302
- 581 Higuera St Unit 301
- 968 Walnut St Unit 4
- 968 Walnut St Unit A-D
- 968 Walnut St
- 974 Walnut St
- 986 Walnut St
- 655 Morro St
- 889 Walnut St
- 979 Walnut St
- 655 Osos St
- 860 Walnut St Unit B
- 860 Walnut St
- 671 Morro St
- 663 Osos St
- 680 Morro St Unit A
- 680 Morro St
- 680 Morro St Unit C
- 680 Morro St Unit ABCD
- 680 Morro St
- 865 Walnut St
- 671 Osos St