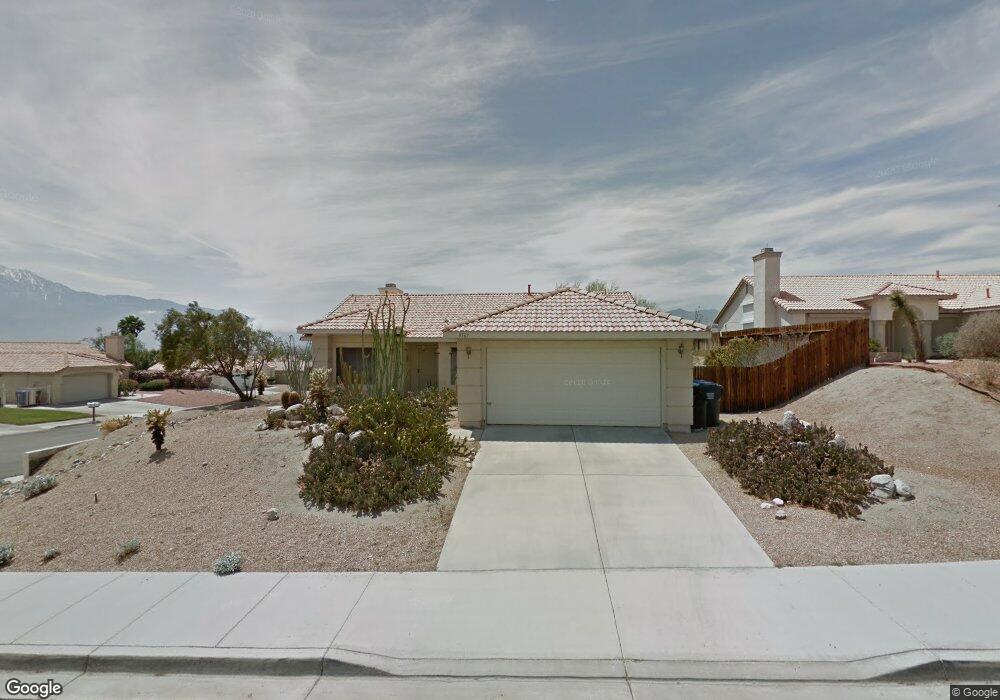
9567 Via Real Desert Hot Springs, CA 92240
Estimated Value: $363,000 - $421,000
3
Beds
2
Baths
1,360
Sq Ft
$284/Sq Ft
Est. Value
About This Home
This home is located at 9567 Via Real, Desert Hot Springs, CA 92240 and is currently estimated at $385,862, approximately $283 per square foot. 9567 Via Real is a home located in Riverside County with nearby schools including Painted Hills Middle School and Desert Hot Springs High School.
Ownership History
Date
Name
Owned For
Owner Type
Purchase Details
Closed on
Aug 11, 2011
Sold by
Normington Charles J and Normington Michael J
Bought by
Normington Michael J
Current Estimated Value
Purchase Details
Closed on
Dec 6, 2007
Sold by
Normington Stacey M
Bought by
Normington Michael J
Purchase Details
Closed on
Jun 14, 2003
Sold by
Normington Charles J
Bought by
Normington Charles J and Normington Marie J
Purchase Details
Closed on
Dec 17, 2001
Sold by
Knorr Owen A and Knorr Marjorie S
Bought by
Normington Charles J
Purchase Details
Closed on
Nov 6, 1997
Sold by
Knorr Marjorie S
Bought by
Knorr Owen A and Knorr Marjorie S
Purchase Details
Closed on
May 2, 1994
Sold by
S H Sanberg & Partners Inc
Bought by
Knorr Owen A and Knorr Marjorie S
Home Financials for this Owner
Home Financials are based on the most recent Mortgage that was taken out on this home.
Original Mortgage
$86,200
Interest Rate
8.1%
Create a Home Valuation Report for This Property
The Home Valuation Report is an in-depth analysis detailing your home's value as well as a comparison with similar homes in the area
Home Values in the Area
Average Home Value in this Area
Purchase History
| Date | Buyer | Sale Price | Title Company |
|---|---|---|---|
| Normington Michael J | -- | None Available | |
| Normington Michael J | -- | Accommodation | |
| Normington Charles J | -- | -- | |
| Normington Charles J | $150,000 | First American Title Co | |
| Knorr Owen A | -- | -- | |
| Knorr Marjorie S | -- | -- | |
| Knorr Owen A | $108,000 | First American Title Ins Co |
Source: Public Records
Mortgage History
| Date | Status | Borrower | Loan Amount |
|---|---|---|---|
| Previous Owner | Knorr Owen A | $86,200 |
Source: Public Records
Tax History Compared to Growth
Tax History
| Year | Tax Paid | Tax Assessment Tax Assessment Total Assessment is a certain percentage of the fair market value that is determined by local assessors to be the total taxable value of land and additions on the property. | Land | Improvement |
|---|---|---|---|---|
| 2025 | $6,159 | $125,590 | $25,113 | $100,477 |
| 2023 | $6,159 | $120,715 | $24,139 | $96,576 |
| 2022 | $6,059 | $118,349 | $23,666 | $94,683 |
| 2021 | $5,948 | $116,029 | $23,202 | $92,827 |
| 2020 | $5,910 | $114,841 | $22,965 | $91,876 |
| 2019 | $5,543 | $112,590 | $22,515 | $90,075 |
| 2018 | $5,458 | $110,383 | $22,074 | $88,309 |
| 2017 | $5,411 | $108,220 | $21,642 | $86,578 |
| 2016 | $5,302 | $106,099 | $21,218 | $84,881 |
| 2015 | $1,736 | $104,507 | $20,900 | $83,607 |
| 2014 | $1,712 | $102,462 | $20,492 | $81,970 |
Source: Public Records
Map
Nearby Homes
- 65820 Pico Ave
- 0 Avenida Jalisco Unit JT25151327
- 66026 Avenida Cadena
- 65975 Avenida Ladera
- 66199 Avenida Suenos
- 65617 Avenida Cadena
- 66161 Avenida Dorado
- 66247 Avenida Suenos
- 66034 Santa Rosa Rd
- 0 Santa Rosa Rd Unit 219134587DA
- 0 Santa Rosa Rd Unit IG25140901
- 65537 Avenida Dorado
- 66191 Mission Lakes Blvd
- 0 Calle Fundador Unit 219132017DA
- 0 Mission Lakes Blvd Unit AR18013140
- 0 Mission Lakes Blvd Unit AR21025299
- 9700 Santa Cruz Rd
- 66167 14th St
- 10168 Santa Cruz Rd
- 9228 Calle de Vecinos
- 9559 Via Real
- 65885 Avenida Pico
- 65877 Avenida Pico
- 9574 Via Real
- 65865 Avenida Pico
- 9566 Via Real
- 9539 Via Real
- 65905 Avenida Pico
- 9550 Oro Ct
- 65851 Avenida Pico
- 9552 Via Real
- 9540 Via Real
- 65919 Avenida Pico
- 65882 Avenida Barona
- 65870 Avenida Barona
- 65839 Avenida Pico
- 65858 Avenida Barona
- 65836 Avenida Pico
- 9571 Del Ray Ct
- 9555 Oro Ct