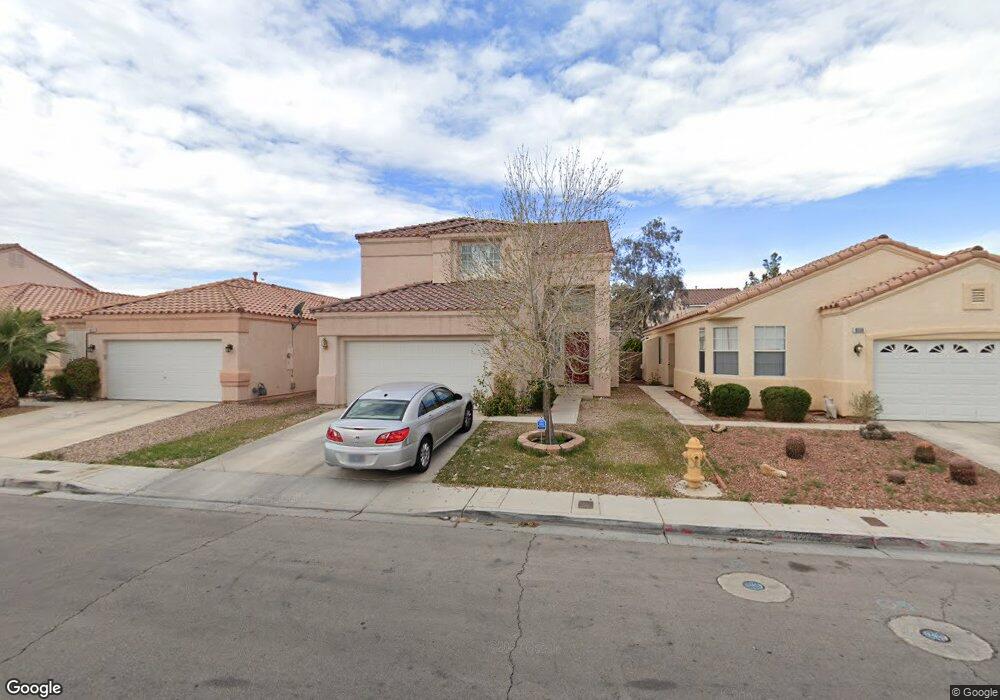
9567 Withering Pine St Las Vegas, NV 89123
Silverado Ranch NeighborhoodEstimated Value: $438,955 - $465,000
3
Beds
3
Baths
1,800
Sq Ft
$251/Sq Ft
Est. Value
About This Home
This home is located at 9567 Withering Pine St, Las Vegas, NV 89123 and is currently estimated at $452,489, approximately $251 per square foot. 9567 Withering Pine St is a home located in Clark County with nearby schools including John R. Hummel Elementary School, Charles Silvestri Junior High School, and Liberty High School.
Ownership History
Date
Name
Owned For
Owner Type
Purchase Details
Closed on
Jan 12, 2010
Sold by
Deutsche Bank National Trust Company
Bought by
Xu Dachuan
Current Estimated Value
Purchase Details
Closed on
Aug 3, 2009
Sold by
Fields Rory
Bought by
Deutsche Bank National Trust Company
Purchase Details
Closed on
May 22, 2002
Sold by
King John W and King Crystal D
Bought by
Fields Rory
Home Financials for this Owner
Home Financials are based on the most recent Mortgage that was taken out on this home.
Original Mortgage
$132,000
Interest Rate
7.99%
Purchase Details
Closed on
Nov 30, 1999
Sold by
Trident Homes Of Nevada Inc
Bought by
King John W and King Crystal D
Home Financials for this Owner
Home Financials are based on the most recent Mortgage that was taken out on this home.
Original Mortgage
$133,878
Interest Rate
7.84%
Mortgage Type
FHA
Create a Home Valuation Report for This Property
The Home Valuation Report is an in-depth analysis detailing your home's value as well as a comparison with similar homes in the area
Home Values in the Area
Average Home Value in this Area
Purchase History
| Date | Buyer | Sale Price | Title Company |
|---|---|---|---|
| Xu Dachuan | $140,000 | Lawyers Title Of Nevada Hen | |
| Deutsche Bank National Trust Company | $230,000 | None Available | |
| Fields Rory | $165,000 | Lawyers Title | |
| King John W | $134,775 | Land Title |
Source: Public Records
Mortgage History
| Date | Status | Borrower | Loan Amount |
|---|---|---|---|
| Previous Owner | Fields Rory | $132,000 | |
| Previous Owner | King John W | $133,878 | |
| Closed | Fields Rory | $33,000 |
Source: Public Records
Tax History Compared to Growth
Tax History
| Year | Tax Paid | Tax Assessment Tax Assessment Total Assessment is a certain percentage of the fair market value that is determined by local assessors to be the total taxable value of land and additions on the property. | Land | Improvement |
|---|---|---|---|---|
| 2025 | $2,190 | $105,550 | $39,550 | $66,000 |
| 2024 | $2,028 | $105,550 | $39,550 | $66,000 |
| 2023 | $2,028 | $95,599 | $33,250 | $62,349 |
| 2022 | $2,152 | $84,766 | $27,650 | $57,116 |
| 2021 | $1,740 | $80,153 | $25,900 | $54,253 |
| 2020 | $1,612 | $79,739 | $25,900 | $53,839 |
| 2019 | $1,511 | $73,312 | $20,300 | $53,012 |
| 2018 | $1,442 | $68,278 | $17,500 | $50,778 |
| 2017 | $1,961 | $66,848 | $15,400 | $51,448 |
| 2016 | $1,350 | $62,532 | $11,900 | $50,632 |
| 2015 | $1,347 | $51,227 | $9,450 | $41,777 |
| 2014 | $1,305 | $43,175 | $7,000 | $36,175 |
Source: Public Records
Map
Nearby Homes
- 70 Belle Essence Ave
- 59 Belle Maison Ave
- 56 Belle Ridge Ave
- 50 Belle La Blanc Ave
- 9612 Flying Eagle Ln
- 9572 Belle Rich St
- 68 E Serene Ave Unit 102
- 68 E Serene Ave Unit 325
- 20 E Serene Ave Unit 404
- 20 E Serene Ave Unit 201
- 59 E Agate Ave Unit 303
- 9920 Rancho Destino Rd
- 2615 W Gary Ave Unit 2067
- 2615 W Gary Ave Unit 2051
- 2615 W Gary Ave Unit 2013
- 62 E Serene Ave Unit 115
- 62 E Serene Ave Unit 129
- 56 E Serene Ave Unit 120
- 56 E Serene Ave Unit 306
- 75 E Agate Ave Unit 206
- 9559 Withering Pine St
- 9575 Withering Pine St
- 9551 Withering Pine St Unit 1
- 9583 Withering Pine St
- 9575 Belle Reserve St
- 9575 Belle Reserve St Unit n/a
- 9591 Withering Pine St
- 9543 Withering Pine St
- 9543 Withering Pine St Unit none
- 9571 Belle Reserve St
- 9579 Belle Reserve St
- 9583 Belle Reserve St
- 9563 Belle Reserve St
- 9587 Belle Reserve St
- 9576 Withering Pine St Unit 1
- 9559 Belle Reserve St
- 9599 Withering Pine St Unit 1
- 9535 Withering Pine St
- 9584 Withering Pine St
- 92 Beaver Falls Ave