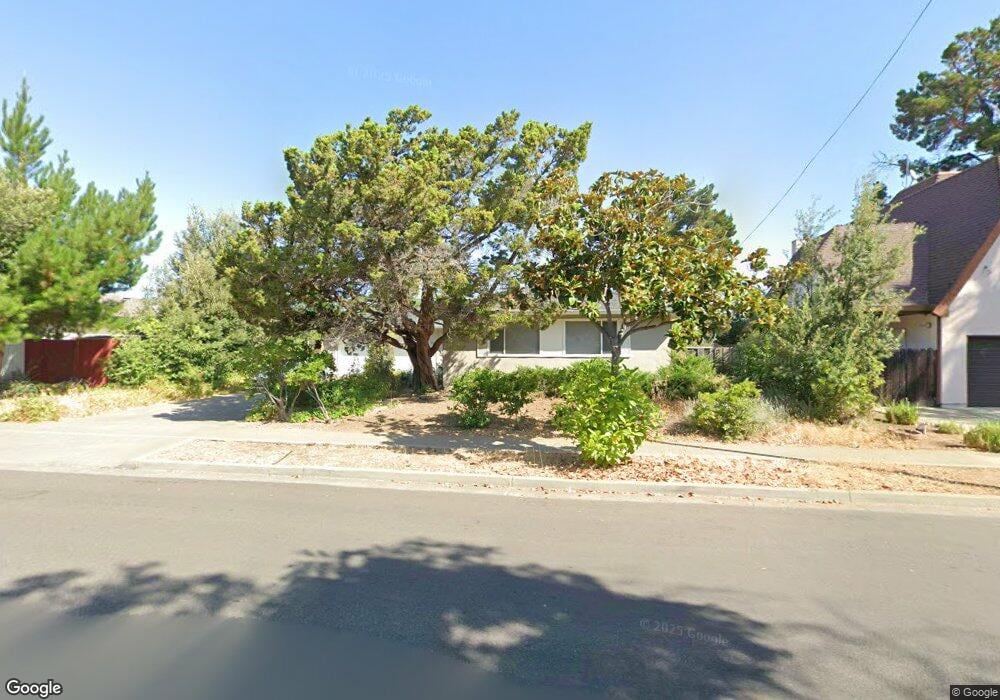
957 Cascade Dr Sunnyvale, CA 94087
Estimated Value: $2,659,000 - $3,050,000
4
Beds
2
Baths
1,407
Sq Ft
$2,034/Sq Ft
Est. Value
About This Home
This home is located at 957 Cascade Dr, Sunnyvale, CA 94087 and is currently estimated at $2,862,054, approximately $2,034 per square foot. 957 Cascade Dr is a home located in Santa Clara County with nearby schools including West Valley Elementary School, Cupertino Middle School, and Homestead High School.
Ownership History
Date
Name
Owned For
Owner Type
Purchase Details
Closed on
Oct 15, 2009
Sold by
Kao Wei and Yan Alice
Bought by
Kao Wei and Yan Alice
Current Estimated Value
Home Financials for this Owner
Home Financials are based on the most recent Mortgage that was taken out on this home.
Original Mortgage
$240,000
Outstanding Balance
$149,948
Interest Rate
4.25%
Mortgage Type
New Conventional
Estimated Equity
$2,712,106
Purchase Details
Closed on
Nov 20, 1999
Sold by
Hsin Chen Chih
Bought by
Kao Wei Wayne and Yan Alice M
Home Financials for this Owner
Home Financials are based on the most recent Mortgage that was taken out on this home.
Original Mortgage
$380,000
Interest Rate
3.45%
Purchase Details
Closed on
Feb 17, 1998
Sold by
Mayer Betty L and Mayer Betty L
Bought by
Chen Chih Hsin
Create a Home Valuation Report for This Property
The Home Valuation Report is an in-depth analysis detailing your home's value as well as a comparison with similar homes in the area
Home Values in the Area
Average Home Value in this Area
Purchase History
| Date | Buyer | Sale Price | Title Company |
|---|---|---|---|
| Kao Wei | -- | North American Title Company | |
| Kao Wei Wayne | $656,000 | Chicago Title Co | |
| Chen Chih Hsin | $485,000 | First American Title Guarant |
Source: Public Records
Mortgage History
| Date | Status | Borrower | Loan Amount |
|---|---|---|---|
| Open | Kao Wei | $240,000 | |
| Closed | Kao Wei Wayne | $380,000 |
Source: Public Records
Tax History Compared to Growth
Tax History
| Year | Tax Paid | Tax Assessment Tax Assessment Total Assessment is a certain percentage of the fair market value that is determined by local assessors to be the total taxable value of land and additions on the property. | Land | Improvement |
|---|---|---|---|---|
| 2025 | $11,537 | $1,008,240 | $630,156 | $378,084 |
| 2024 | $11,537 | $988,471 | $617,800 | $370,671 |
| 2023 | $11,479 | $969,090 | $605,687 | $363,403 |
| 2022 | $11,528 | $950,089 | $593,811 | $356,278 |
| 2021 | $11,428 | $931,461 | $582,168 | $349,293 |
| 2020 | $11,299 | $921,911 | $576,199 | $345,712 |
| 2019 | $11,051 | $903,835 | $564,901 | $338,934 |
| 2018 | $10,799 | $886,114 | $553,825 | $332,289 |
| 2017 | $10,746 | $868,740 | $542,966 | $325,774 |
| 2016 | $10,438 | $851,707 | $532,320 | $319,387 |
| 2015 | $10,379 | $838,915 | $524,325 | $314,590 |
| 2014 | $10,126 | $822,483 | $514,055 | $308,428 |
Source: Public Records
Map
Nearby Homes
- 1416 S Mary Ave
- 1507 Dominion Ave
- 1243 E Fremont Terrace
- 1244 Elderberry Dr
- 1402 Bedford Ave
- 839 Springfield Terrace
- 725 Winstead Terrace
- 1020 W Homestead Rd
- 1624 Clay Dr
- 1901 Alford Ave
- 1768 Karameos Ct
- 1660 Elmhurst Dr
- 1686 Parkhills Ave
- 10881 Barranca Dr
- 974 Pocatello Ave
- 1140 Snowberry Ct
- 532 Cashmere Ct
- 22330 Homestead Rd Unit 307
- 10715 Grapnel Place
- 654 Princeton Dr
- 965 Cascade Dr
- 974 Bonneville Way
- 982 Bonneville Way
- 966 Bonneville Way
- 973 Cascade Dr
- 941 Cascade Dr
- 958 Cascade Dr
- 966 Cascade Dr
- 990 Bonneville Way
- 946 Bonneville Way
- 974 Cascade Dr
- 981 Cascade Dr
- 933 Cascade Dr
- 1402 Galloway Ct
- 998 Bonneville Way
- 1374 Frontenac Ave
- 928 Bonneville Way
- 1373 Frontenac Ave
- 982 Cascade Dr
- 1409 Galloway Ct