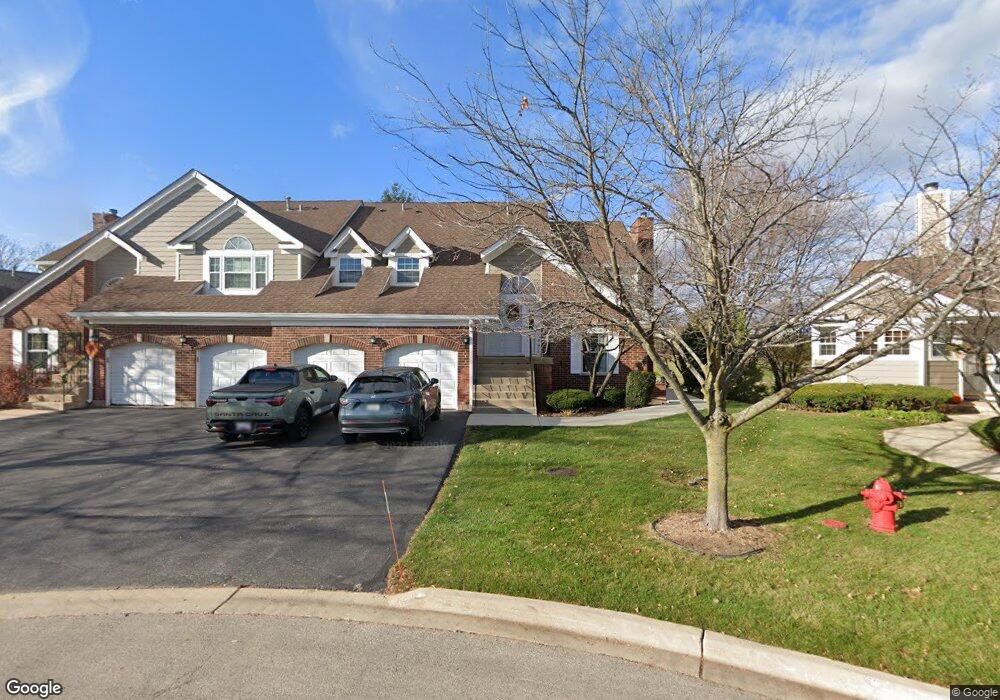
957 Interloch Ct Unit 84 Algonquin, IL 60102
Estimated Value: $286,350 - $301,000
2
Beds
2
Baths
1,649
Sq Ft
$178/Sq Ft
Est. Value
About This Home
This home is located at 957 Interloch Ct Unit 84, Algonquin, IL 60102 and is currently estimated at $294,338, approximately $178 per square foot. 957 Interloch Ct Unit 84 is a home located in McHenry County with nearby schools including Westfield Community School, Kenneth E Neubert Elementary School, and Harry D Jacobs High School.
Ownership History
Date
Name
Owned For
Owner Type
Purchase Details
Closed on
May 22, 2015
Sold by
Wood Nancy L
Bought by
Lorusso Nick M and Lorusso Diana
Current Estimated Value
Home Financials for this Owner
Home Financials are based on the most recent Mortgage that was taken out on this home.
Original Mortgage
$92,250
Outstanding Balance
$71,983
Interest Rate
4.12%
Mortgage Type
New Conventional
Estimated Equity
$222,355
Purchase Details
Closed on
Mar 18, 2009
Sold by
Warpula Sandra L
Bought by
Warpula Sandra L and Wood Nancy L
Purchase Details
Closed on
Jun 3, 1999
Sold by
Shedd Thomas C and Shedd Shirley I
Bought by
Warpula Sandra L
Home Financials for this Owner
Home Financials are based on the most recent Mortgage that was taken out on this home.
Original Mortgage
$55,000
Interest Rate
6.62%
Create a Home Valuation Report for This Property
The Home Valuation Report is an in-depth analysis detailing your home's value as well as a comparison with similar homes in the area
Purchase History
| Date | Buyer | Sale Price | Title Company |
|---|---|---|---|
| Lorusso Nick M | $123,000 | Heritage Title Company | |
| Wood Nancy L | -- | Heritage Title Company | |
| Wood Nancy L | -- | Heritage Title Company | |
| Warpula Sandra L | -- | None Available | |
| Warpula Sandra L | $137,000 | -- |
Source: Public Records
Mortgage History
| Date | Status | Borrower | Loan Amount |
|---|---|---|---|
| Open | Lorusso Nick M | $92,250 | |
| Previous Owner | Warpula Sandra L | $55,000 |
Source: Public Records
Tax History
| Year | Tax Paid | Tax Assessment Tax Assessment Total Assessment is a certain percentage of the fair market value that is determined by local assessors to be the total taxable value of land and additions on the property. | Land | Improvement |
|---|---|---|---|---|
| 2024 | $4,329 | $76,345 | $15,898 | $60,447 |
| 2023 | $3,958 | $68,281 | $14,219 | $54,062 |
| 2022 | $4,322 | $63,898 | $22,054 | $41,844 |
| 2021 | $4,084 | $59,529 | $20,546 | $38,983 |
| 2020 | $5,156 | $57,422 | $19,819 | $37,603 |
| 2019 | $5,047 | $54,960 | $18,969 | $35,991 |
| 2018 | $4,958 | $52,011 | $17,523 | $34,488 |
| 2017 | $4,879 | $48,998 | $16,508 | $32,490 |
| 2016 | $4,833 | $45,956 | $15,483 | $30,473 |
| 2013 | -- | $40,900 | $14,444 | $26,456 |
Source: Public Records
Map
Nearby Homes
- 1033 Interloch Ct Unit 32
- 1820 Crofton Dr
- 741 Regal Ln
- 760 Regal Ln
- 1 N Hubbard St
- SWC Talaga and Algonquin Rd
- 700 Fairfield Ln
- 681 Majestic Dr
- 2233 Dawson Ln Unit 312
- 1157 Sawmill Ln
- 20 Peach Tree Ct Unit 4153
- 18 Peach Tree Ct Unit 4154
- 1920 Jester Ln
- 2380 Dawson Ln Unit 165
- 2069 Peach Tree Ln Unit 4116
- 1105 Spring Hill Dr
- 1831 Haverford Dr
- 615 Harper Dr
- 1900 Waverly Ln
- 721 Brentwood Ct
- 957 Interloch Ct Unit 957
- 955 Interloch Ct Unit 82
- 953 Interloch Ct Unit 83
- 951 Interloch Ct Unit 81
- 961 Interloch Ct
- 963 Interloch Ct Unit 72
- 1655 Glengarry Ct Unit 103
- 1657 Glengarry Ct Unit 104
- 965 Interloch Ct Unit 73
- 967 Interloch Ct Unit 74
- 1653 Glengarry Ct
- 1651 Glengarry Ct Unit 101
- 973 Interloch Ct Unit 62
- 973 Interloch Ct Unit 973
- 971 Interloch Ct
- 977 Interloch Ct Unit 64
- 975 Interloch Ct Unit 63
- 1641 Glengarry Ct Unit 111
- 1623 Glengarry Ct Unit 133
- 1645 Glengarry Ct Unit 112