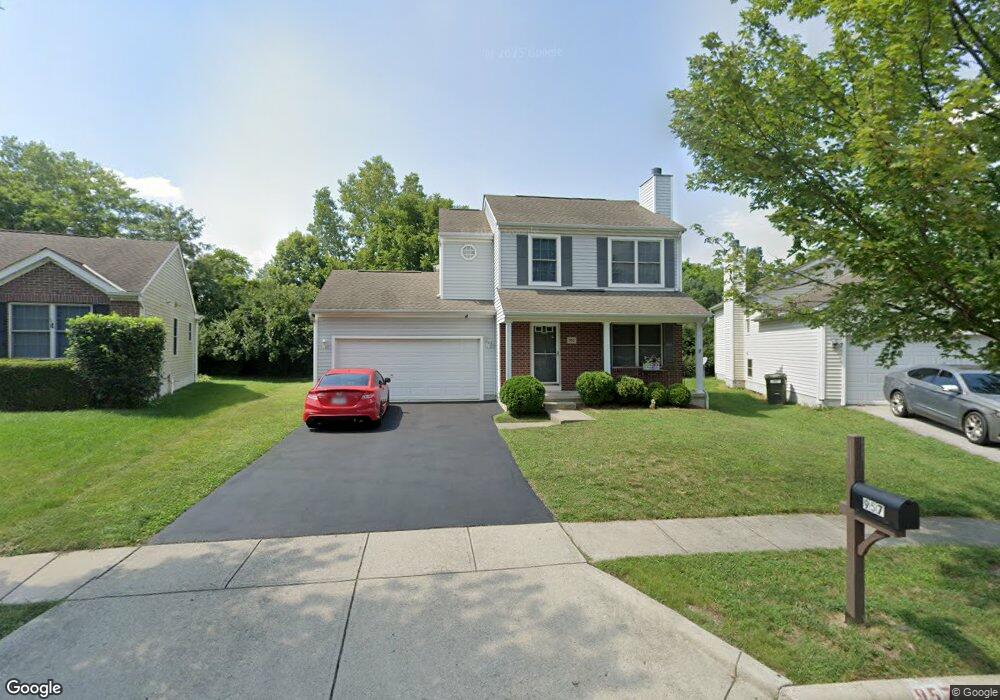
957 Rowland Ave Columbus, OH 43228
Georgian Heights NeighborhoodEstimated Value: $301,000 - $309,842
3
Beds
3
Baths
1,500
Sq Ft
$204/Sq Ft
Est. Value
About This Home
This home is located at 957 Rowland Ave, Columbus, OH 43228 and is currently estimated at $306,711, approximately $204 per square foot. 957 Rowland Ave is a home located in Franklin County with nearby schools including Prairie Norton Elementary School, Pleasant View Middle School, and Central Crossing High School.
Ownership History
Date
Name
Owned For
Owner Type
Purchase Details
Closed on
Oct 1, 2016
Sold by
Xayavong Phetmany and Sopraseuth Nalong
Bought by
Sopraseuth Nalong
Current Estimated Value
Purchase Details
Closed on
Apr 26, 2010
Sold by
Hsbc Bank Usa National Association
Bought by
Xayavong Phetmany and Sopraseuth Nalong
Home Financials for this Owner
Home Financials are based on the most recent Mortgage that was taken out on this home.
Original Mortgage
$108,538
Interest Rate
4.87%
Mortgage Type
FHA
Purchase Details
Closed on
Jan 19, 2010
Sold by
Sheeley Rich and Sheeley Richard S
Bought by
Hsbc Bank Usa National Association
Purchase Details
Closed on
Mar 16, 2004
Sold by
Dominion Homes Inc
Bought by
Sheeley Rich
Home Financials for this Owner
Home Financials are based on the most recent Mortgage that was taken out on this home.
Original Mortgage
$173,148
Interest Rate
5.65%
Mortgage Type
FHA
Create a Home Valuation Report for This Property
The Home Valuation Report is an in-depth analysis detailing your home's value as well as a comparison with similar homes in the area
Home Values in the Area
Average Home Value in this Area
Purchase History
| Date | Buyer | Sale Price | Title Company |
|---|---|---|---|
| Sopraseuth Nalong | -- | None Available | |
| Xayavong Phetmany | $110,000 | Attorney | |
| Hsbc Bank Usa National Association | $96,000 | None Available | |
| Sheeley Rich | $74,600 | Alliance Title |
Source: Public Records
Mortgage History
| Date | Status | Borrower | Loan Amount |
|---|---|---|---|
| Previous Owner | Xayavong Phetmany | $108,538 | |
| Previous Owner | Sheeley Rich | $173,148 |
Source: Public Records
Tax History Compared to Growth
Tax History
| Year | Tax Paid | Tax Assessment Tax Assessment Total Assessment is a certain percentage of the fair market value that is determined by local assessors to be the total taxable value of land and additions on the property. | Land | Improvement |
|---|---|---|---|---|
| 2024 | $3,325 | $91,180 | $24,820 | $66,360 |
| 2023 | $3,266 | $91,175 | $24,815 | $66,360 |
| 2022 | $2,670 | $54,710 | $8,400 | $46,310 |
| 2021 | $2,724 | $54,710 | $8,400 | $46,310 |
| 2020 | $2,785 | $56,250 | $8,400 | $47,850 |
| 2019 | $2,619 | $46,690 | $7,000 | $39,690 |
| 2018 | $2,600 | $46,690 | $7,000 | $39,690 |
| 2017 | $2,594 | $46,690 | $7,000 | $39,690 |
| 2016 | $2,593 | $42,850 | $9,280 | $33,570 |
| 2015 | $2,593 | $42,850 | $9,280 | $33,570 |
| 2014 | $2,595 | $42,850 | $9,280 | $33,570 |
| 2013 | $1,430 | $47,600 | $10,290 | $37,310 |
Source: Public Records
Map
Nearby Homes
- 4518 Hall Rd
- 4482 Amwood St
- 4459 Amwood St
- 4848 Deephollow Dr
- 4715 Sullivant Ave Unit 46
- 4789 Dolan Place
- 829 Crevis Ln
- 4483 White Leaf Way
- 4950 Cherry Creek Pkwy S
- 4201 Sexton Dr
- 4212 Sexton Dr
- 4190 Salem Dr
- 4763 Hafey Ave
- 673 Roth Ave
- 4146 Sexton Dr
- 4220 Atlanta Dr
- 4778 Hafey Ave
- 488 Lombard Rd
- 840 Cherry Bud Dr
- 4419 Hammerton Dr Unit 13D
- 965 Rowland Ave
- 949 Rowland Ave
- 949 Rowland Ave Unit 21
- 973 Rowland Ave
- 4586 Trickle Creek Ln
- 981 Rowland Ave
- 981 Rowland Ave Unit 17
- 4578 Trickle Creek Ln
- 964 Rowland Ave
- 964 Rowland Ave Unit 25
- 972 Rowland Ave
- 972 Rowland Ave Unit 26
- 989 Rowland Ave
- 989 Rowland Ave Unit 16
- 980 Rowland Ave
- 980 Rowland Ave Unit 27
- 4570 Trickle Creek Ln
- 4570 Trickle Creek Ln Unit 24
- 988 Rowland Ave
- 988 Rowland Ave Unit 28