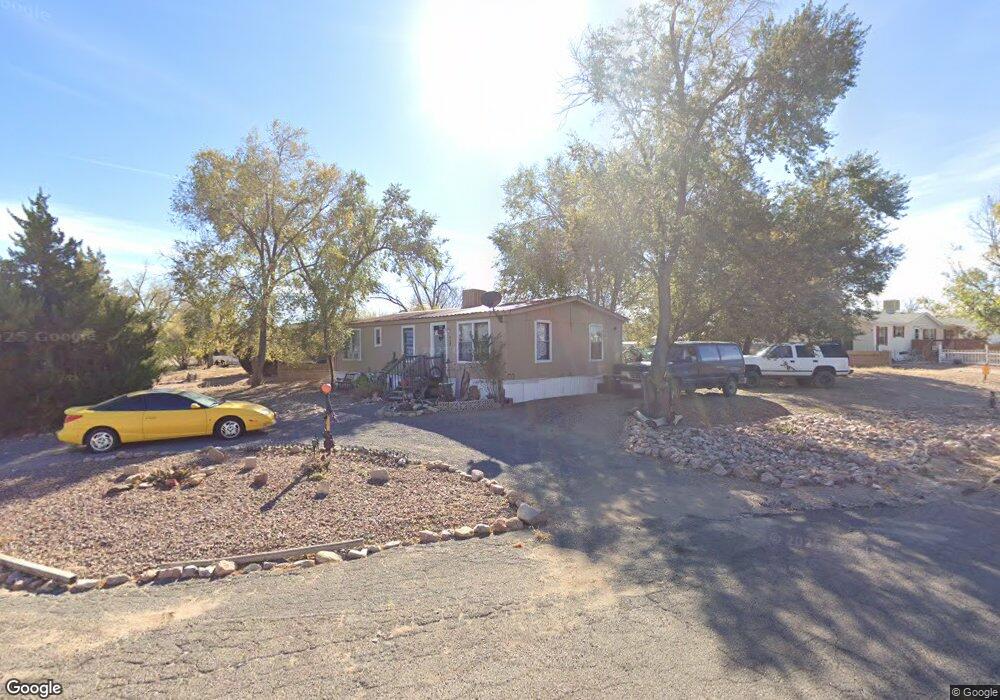
957 S Blueridge Dr Pueblo, CO 81007
Estimated Value: $161,000 - $181,000
2
Beds
1
Bath
960
Sq Ft
$178/Sq Ft
Est. Value
About This Home
This home is located at 957 S Blueridge Dr, Pueblo, CO 81007 and is currently estimated at $171,000, approximately $178 per square foot. 957 S Blueridge Dr is a home located in Pueblo County with nearby schools including Desert Sage Elementary School, Liberty Point International School, and Pueblo West High School.
Ownership History
Date
Name
Owned For
Owner Type
Purchase Details
Closed on
Mar 8, 2024
Sold by
Tnc Investments Inc
Bought by
Koehler John and Koehler Rene
Current Estimated Value
Purchase Details
Closed on
Mar 22, 2007
Sold by
The Pueblo Bank & Trust Co
Bought by
T N C Investments Inc
Home Financials for this Owner
Home Financials are based on the most recent Mortgage that was taken out on this home.
Original Mortgage
$13,000
Interest Rate
6.26%
Mortgage Type
Purchase Money Mortgage
Purchase Details
Closed on
Aug 24, 2005
Sold by
Mahinske Steven and Mahinske Richard
Bought by
The Pueblo Bank & Trust Co
Purchase Details
Closed on
Dec 5, 1996
Sold by
Mahinske Steven
Bought by
Mahinske Steven + Sally
Purchase Details
Closed on
Jan 28, 1987
Sold by
Lawyers Title Of Pueblo Inc Tr
Bought by
Mahinske Richard L + Steven
Purchase Details
Closed on
Sep 2, 1983
Bought by
Lawyers Title Of Pueblo Inc Tr
Create a Home Valuation Report for This Property
The Home Valuation Report is an in-depth analysis detailing your home's value as well as a comparison with similar homes in the area
Home Values in the Area
Average Home Value in this Area
Purchase History
| Date | Buyer | Sale Price | Title Company |
|---|---|---|---|
| Koehler John | -- | None Listed On Document | |
| T N C Investments Inc | $17,500 | Landamerica | |
| The Pueblo Bank & Trust Co | -- | -- | |
| Mahinske Steven + Sally | -- | -- | |
| Mahinske Richard L + Steven | $21,500 | -- | |
| Lawyers Title Of Pueblo Inc Tr | -- | -- |
Source: Public Records
Mortgage History
| Date | Status | Borrower | Loan Amount |
|---|---|---|---|
| Previous Owner | T N C Investments Inc | $13,000 |
Source: Public Records
Tax History Compared to Growth
Tax History
| Year | Tax Paid | Tax Assessment Tax Assessment Total Assessment is a certain percentage of the fair market value that is determined by local assessors to be the total taxable value of land and additions on the property. | Land | Improvement |
|---|---|---|---|---|
| 2024 | $582 | $5,760 | -- | -- |
| 2023 | $588 | $9,440 | $1,840 | $7,600 |
| 2022 | $646 | $6,440 | $1,910 | $4,530 |
| 2021 | $663 | $6,630 | $1,970 | $4,660 |
| 2020 | $351 | $6,630 | $1,970 | $4,660 |
| 2019 | $349 | $3,493 | $965 | $2,528 |
| 2018 | $246 | $2,457 | $972 | $1,485 |
| 2017 | $246 | $2,457 | $972 | $1,485 |
| 2016 | $256 | $2,562 | $1,075 | $1,487 |
| 2015 | $127 | $2,562 | $1,075 | $1,487 |
| 2014 | $125 | $2,518 | $1,075 | $1,443 |
Source: Public Records
Map
Nearby Homes
- 965 S Blueridge Dr
- 138 E Birch Hills Dr
- 973 S Blueridge Dr
- 132 E Birch Hills Dr
- 157 E Birch Hills Dr
- 139 E Birch Hills Dr
- 165 E Birch Hills Dr
- 981 S Blueridge Dr
- 126 E Birch Hills Dr Unit 14
- 171 E Birch Hills Dr
- 127 E Birch Hills Dr Unit 10
- 986 S Dawnview Dr
- 120 E Birch Hills Dr Unit 13
- 120 E Birch Hills Dr
- 152 E Countryside Dr
- 152 E Countryside Dr Unit 36
- 158 E Countryside Dr Unit 37
- 177 E Birch Hills Dr
- 140 E Countryside Dr Unit 34
- 140 E Countryside Dr