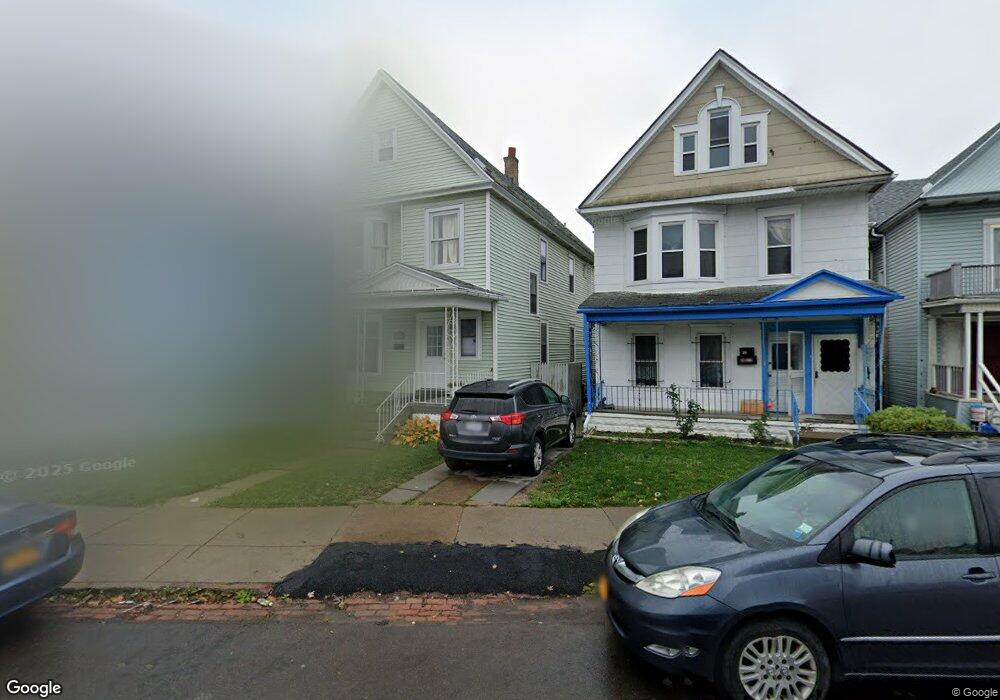
957 Sycamore St Buffalo, NY 14212
Broadway-Fillmore NeighborhoodEstimated Value: $98,870 - $149,000
6
Beds
2
Baths
2,341
Sq Ft
$49/Sq Ft
Est. Value
About This Home
This home is located at 957 Sycamore St, Buffalo, NY 14212 and is currently estimated at $115,468, approximately $49 per square foot. 957 Sycamore St is a home located in Erie County with nearby schools including Darul Uloom Al Madania and Saints Tabernacle Of Excellence.
Ownership History
Date
Name
Owned For
Owner Type
Purchase Details
Closed on
Jan 23, 2017
Sold by
Coad Mildred
Bought by
Bhuiyan Real Estate Corporation
Current Estimated Value
Purchase Details
Closed on
Jun 27, 2005
Sold by
Broadway Fillmore Neighborhood Housing S
Bought by
Coad Mildred
Home Financials for this Owner
Home Financials are based on the most recent Mortgage that was taken out on this home.
Original Mortgage
$12,538
Interest Rate
5.79%
Mortgage Type
Fannie Mae Freddie Mac
Create a Home Valuation Report for This Property
The Home Valuation Report is an in-depth analysis detailing your home's value as well as a comparison with similar homes in the area
Home Values in the Area
Average Home Value in this Area
Purchase History
| Date | Buyer | Sale Price | Title Company |
|---|---|---|---|
| Bhuiyan Real Estate Corporation | $15,000 | None Available | |
| Coad Mildred | $999,000 | None Available |
Source: Public Records
Mortgage History
| Date | Status | Borrower | Loan Amount |
|---|---|---|---|
| Previous Owner | Coad Mildred | $12,538 |
Source: Public Records
Tax History Compared to Growth
Tax History
| Year | Tax Paid | Tax Assessment Tax Assessment Total Assessment is a certain percentage of the fair market value that is determined by local assessors to be the total taxable value of land and additions on the property. | Land | Improvement |
|---|---|---|---|---|
| 2024 | $168 | $30,000 | $2,000 | $28,000 |
| 2023 | $152 | $30,000 | $2,000 | $28,000 |
| 2022 | $151 | $30,000 | $2,000 | $28,000 |
| 2021 | $151 | $30,000 | $2,000 | $28,000 |
| 2020 | $165 | $30,000 | $2,000 | $28,000 |
| 2019 | $587 | $21,400 | $1,800 | $19,600 |
| 2018 | $552 | $21,400 | $1,800 | $19,600 |
| 2017 | $127 | $21,400 | $1,800 | $19,600 |
| 2016 | $205 | $21,400 | $1,800 | $19,600 |
| 2015 | -- | $21,400 | $1,800 | $19,600 |
| 2014 | -- | $21,400 | $1,800 | $19,600 |
Source: Public Records
Map
Nearby Homes