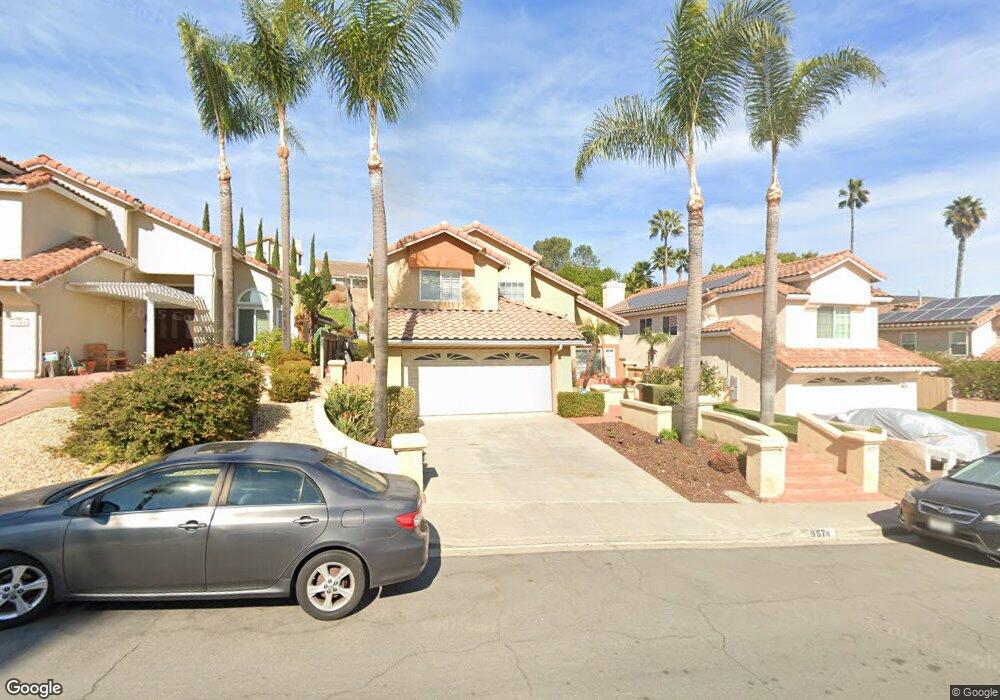
9574 Vervain St San Diego, CA 92129
Rancho Peñasquitos NeighborhoodEstimated Value: $1,409,000 - $1,756,000
4
Beds
4
Baths
2,903
Sq Ft
$545/Sq Ft
Est. Value
About This Home
This home is located at 9574 Vervain St, San Diego, CA 92129 and is currently estimated at $1,582,115, approximately $544 per square foot. 9574 Vervain St is a home located in San Diego County with nearby schools including Canyon View Elementary School, Mesa Verde Middle School, and Westview High School.
Ownership History
Date
Name
Owned For
Owner Type
Purchase Details
Closed on
Dec 22, 1993
Sold by
Carini Alfredo and Carini Susanna Asaro
Bought by
Carini Alfredo and Carini Susanna Asaro
Current Estimated Value
Home Financials for this Owner
Home Financials are based on the most recent Mortgage that was taken out on this home.
Original Mortgage
$102,000
Interest Rate
6.88%
Purchase Details
Closed on
Nov 18, 1993
Sold by
Carini Alfredo and Carini Susanna Asaro
Bought by
Carini Alfredo and Carini Susanna A
Home Financials for this Owner
Home Financials are based on the most recent Mortgage that was taken out on this home.
Original Mortgage
$102,000
Interest Rate
6.88%
Purchase Details
Closed on
Oct 27, 1993
Sold by
Carini Alfredo and Carini Susanna Asaro
Bought by
Carini Alfredo and Carini Susanna Asaro
Home Financials for this Owner
Home Financials are based on the most recent Mortgage that was taken out on this home.
Original Mortgage
$102,000
Interest Rate
6.88%
Purchase Details
Closed on
Feb 10, 1987
Create a Home Valuation Report for This Property
The Home Valuation Report is an in-depth analysis detailing your home's value as well as a comparison with similar homes in the area
Home Values in the Area
Average Home Value in this Area
Purchase History
| Date | Buyer | Sale Price | Title Company |
|---|---|---|---|
| Carini Alfredo | -- | -- | |
| Carini Alfredo | -- | South Coast Title Company | |
| Carini Alfredo | -- | -- | |
| -- | $166,400 | -- |
Source: Public Records
Mortgage History
| Date | Status | Borrower | Loan Amount |
|---|---|---|---|
| Closed | Carini Alfredo | $102,000 |
Source: Public Records
Tax History Compared to Growth
Tax History
| Year | Tax Paid | Tax Assessment Tax Assessment Total Assessment is a certain percentage of the fair market value that is determined by local assessors to be the total taxable value of land and additions on the property. | Land | Improvement |
|---|---|---|---|---|
| 2025 | $4,499 | $408,725 | $83,122 | $325,603 |
| 2024 | $4,499 | $400,712 | $81,493 | $319,219 |
| 2023 | $4,403 | $392,856 | $79,896 | $312,960 |
| 2022 | $4,328 | $385,154 | $78,330 | $306,824 |
| 2021 | $4,271 | $377,603 | $76,795 | $300,808 |
| 2020 | $4,211 | $373,732 | $76,008 | $297,724 |
| 2019 | $4,097 | $366,405 | $74,518 | $291,887 |
| 2018 | $3,978 | $359,221 | $73,057 | $286,164 |
| 2017 | $3,868 | $352,178 | $71,625 | $280,553 |
| 2016 | $3,787 | $345,273 | $70,221 | $275,052 |
| 2015 | $3,727 | $340,088 | $69,167 | $270,921 |
| 2014 | $3,638 | $333,428 | $67,813 | $265,615 |
Source: Public Records
Map
Nearby Homes
- 9525 Vervain St
- 13202 Salmon River Rd Unit 101
- 9446 Pipilo St
- 9458 Twin Trails Dr Unit 205
- 13292 Salmon River Rd Unit 204
- 9720 Graceland Way
- 12727 Calle de Las Rosas
- 9342 Twin Trails Dr Unit 303
- 9525 High Park Ln
- 9302 Twin Trails Dr Unit 204
- 9488 Hiker Hill Rd
- 13411 Appalachian Way
- 13445 Appalachian Way
- 13640 Via Cima Bella
- 12940 Calle de Las Rosas
- 9555 Via Pereza
- 12979 Calle de Las Rosas
- 12776 Isocoma St Unit 4
- 9959 Azuaga St Unit 105
- 13045 Texana St
- 9582 Vervain St
- 9566 Vervain St
- 9588 Vervain St
- 9558 Vervain St
- 9575 Pipilo St
- 9585 Pipilo St
- 9592 Vervain St
- 9550 Vervain St
- 13030 Salmon River Rd
- 9571 Pipilo St
- 9589 Pipilo St
- 9573 Vervain St
- 9563 Pipilo St
- 9581 Vervain St
- 9565 Vervain St
- 9596 Vervain St
- 9542 Vervain St
- 13050 Salmon River Rd
- 9587 Vervain St
- 9557 Vervain St