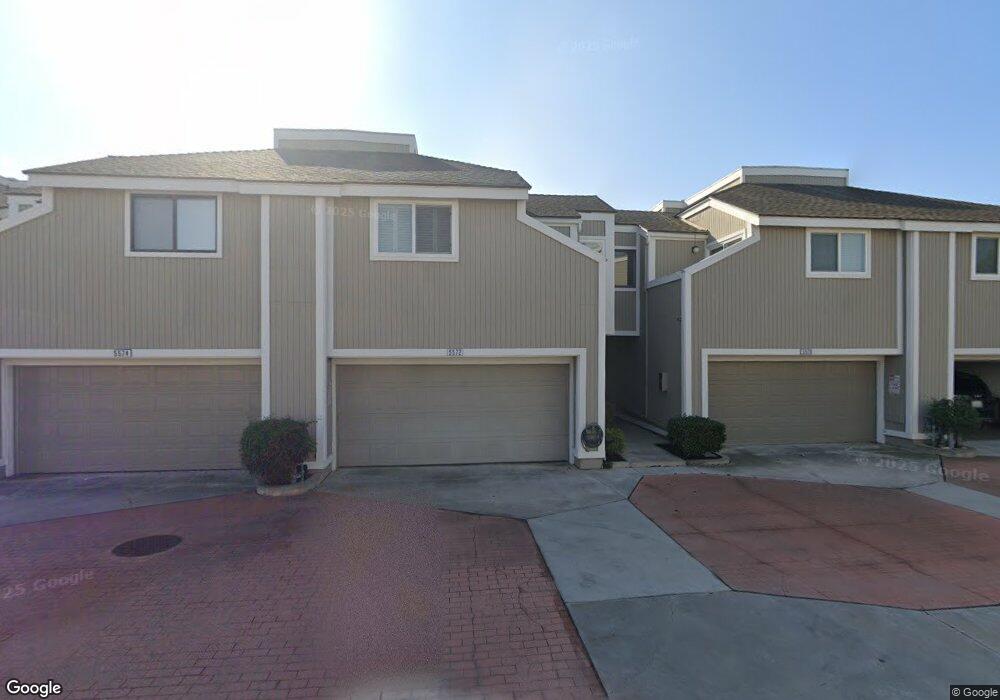
9577 Graham St Cypress, CA 90630
Estimated Value: $697,000 - $747,569
2
Beds
2
Baths
1,160
Sq Ft
$624/Sq Ft
Est. Value
About This Home
This home is located at 9577 Graham St, Cypress, CA 90630 and is currently estimated at $724,142, approximately $624 per square foot. 9577 Graham St is a home located in Orange County with nearby schools including Juliet Morris Elementary School, Lexington Junior High School, and Cypress High School.
Ownership History
Date
Name
Owned For
Owner Type
Purchase Details
Closed on
Jan 16, 2001
Sold by
Seeley Mary Rose
Bought by
Conrad Steven D and Zhang Yu Jue
Current Estimated Value
Home Financials for this Owner
Home Financials are based on the most recent Mortgage that was taken out on this home.
Original Mortgage
$145,600
Interest Rate
7.11%
Purchase Details
Closed on
Apr 12, 1999
Sold by
Rose Seeley Mary
Bought by
Seeley Mary Rose
Home Financials for this Owner
Home Financials are based on the most recent Mortgage that was taken out on this home.
Original Mortgage
$136,000
Interest Rate
7.04%
Purchase Details
Closed on
Sep 16, 1993
Sold by
Seeley Mike T and Seeley Mary Rose
Bought by
Seeley Mary Rose
Create a Home Valuation Report for This Property
The Home Valuation Report is an in-depth analysis detailing your home's value as well as a comparison with similar homes in the area
Home Values in the Area
Average Home Value in this Area
Purchase History
| Date | Buyer | Sale Price | Title Company |
|---|---|---|---|
| Conrad Steven D | $182,000 | Commonwealth Land Title | |
| Seeley Mary Rose | -- | Lawyers Title Company | |
| Seeley Mary Rose | -- | -- |
Source: Public Records
Mortgage History
| Date | Status | Borrower | Loan Amount |
|---|---|---|---|
| Previous Owner | Conrad Steven D | $145,600 | |
| Previous Owner | Seeley Mary Rose | $136,000 | |
| Closed | Conrad Steven D | $27,300 |
Source: Public Records
Tax History
| Year | Tax Paid | Tax Assessment Tax Assessment Total Assessment is a certain percentage of the fair market value that is determined by local assessors to be the total taxable value of land and additions on the property. | Land | Improvement |
|---|---|---|---|---|
| 2025 | $3,311 | $274,233 | $168,311 | $105,922 |
| 2024 | $3,311 | $268,856 | $165,010 | $103,846 |
| 2023 | $3,234 | $263,585 | $161,775 | $101,810 |
| 2022 | $3,193 | $258,417 | $158,603 | $99,814 |
| 2021 | $3,151 | $253,350 | $155,493 | $97,857 |
| 2020 | $3,138 | $250,753 | $153,899 | $96,854 |
| 2019 | $3,055 | $245,837 | $150,882 | $94,955 |
| 2018 | $3,015 | $241,017 | $147,923 | $93,094 |
| 2017 | $2,915 | $236,292 | $145,023 | $91,269 |
| 2016 | $2,891 | $231,659 | $142,179 | $89,480 |
| 2015 | $2,868 | $228,180 | $140,044 | $88,136 |
| 2014 | $2,722 | $223,711 | $137,301 | $86,410 |
Source: Public Records
Map
Nearby Homes
- 5372 Harvard Way
- 5353 Cumberland Dr
- 5843 La Jolla Way Unit 28
- 9332 Nancy St
- 9948 Del Rio Way Unit 98
- 9011 Cerise Ln Unit 129
- 9001 Cerise Ln Unit 109
- 9001 Cerise Ln Unit 113
- 6007 Clementine Ln Unit 21
- 5342 Bishop St
- 5000 Clementine Ln
- 5482 Myra Ave
- 9598 Naples Dr
- 5068 Cumberland Dr
- 5475 Twin Lakes Dr
- 9702 Juanita St
- 6344 Orange Ave
- 5572 Saint Ann Ave
- 4790 Montefino Dr
- 9704 Doreen Dr
- 9575 Graham St
- 9579 Graham St Unit 9
- 9579 Graham St
- 9573 Graham St
- 5570 Orange Ave
- 5572 Orange Ave
- 5574 Orange Ave
- 9571 Graham St
- 5568 Orange Ave
- 5576 Orange Ave
- 9569 Graham St
- 9558 Walker St
- 9556 Walker St
- 9546 Walker St
- 9567 Graham St
- 9529 Graham St
- 9527 Graham St
- 5566 Orange Ave
- 9532 Walker St
- 9525 Graham St
Your Personal Tour Guide
Ask me questions while you tour the home.