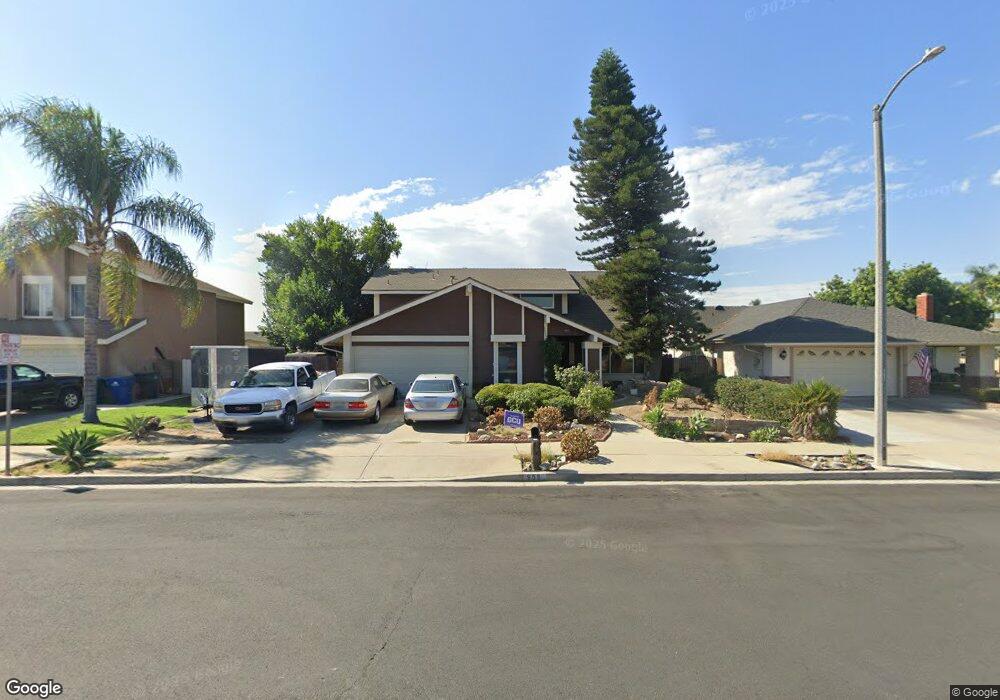
958 E Bermuda Dunes St Ontario, CA 91761
Ontario Ranch NeighborhoodEstimated Value: $772,397 - $857,000
4
Beds
4
Baths
1,969
Sq Ft
$405/Sq Ft
Est. Value
About This Home
This home is located at 958 E Bermuda Dunes St, Ontario, CA 91761 and is currently estimated at $798,349, approximately $405 per square foot. 958 E Bermuda Dunes St is a home located in San Bernardino County with nearby schools including Liberty Elementary School, Woodcrest Junior High, and Chino High School.
Ownership History
Date
Name
Owned For
Owner Type
Purchase Details
Closed on
Jun 22, 2023
Sold by
Garrett Edana
Bought by
Edana Garrett 2023 Revocable Trust and Garrett
Current Estimated Value
Purchase Details
Closed on
Jul 15, 2009
Sold by
Crow James H and Crow Cheryl L
Bought by
Garrett Edana
Home Financials for this Owner
Home Financials are based on the most recent Mortgage that was taken out on this home.
Original Mortgage
$220,000
Interest Rate
5.09%
Mortgage Type
New Conventional
Purchase Details
Closed on
Oct 20, 2006
Sold by
Crow James H and Crow Cheryl L
Bought by
Crow James H and Crow Cheryl L
Purchase Details
Closed on
Jan 5, 2004
Sold by
Crow James and Crow Cheryl
Bought by
Crow James H and Crow Cheryl L
Purchase Details
Closed on
Sep 7, 1994
Sold by
Ruiz Deborah
Bought by
Crow James and Crow Cheryl
Home Financials for this Owner
Home Financials are based on the most recent Mortgage that was taken out on this home.
Original Mortgage
$167,750
Interest Rate
8.55%
Mortgage Type
Assumption
Create a Home Valuation Report for This Property
The Home Valuation Report is an in-depth analysis detailing your home's value as well as a comparison with similar homes in the area
Home Values in the Area
Average Home Value in this Area
Purchase History
| Date | Buyer | Sale Price | Title Company |
|---|---|---|---|
| Edana Garrett 2023 Revocable Trust | -- | None Listed On Document | |
| Garrett Edana | -- | Pacific Coast Title | |
| Crow James H | -- | None Available | |
| Crow James H | -- | Gateway Title | |
| Crow James | $168,000 | Orange Coast Title Co |
Source: Public Records
Mortgage History
| Date | Status | Borrower | Loan Amount |
|---|---|---|---|
| Previous Owner | Garrett Edana | $220,000 | |
| Previous Owner | Crow James | $167,750 |
Source: Public Records
Tax History
| Year | Tax Paid | Tax Assessment Tax Assessment Total Assessment is a certain percentage of the fair market value that is determined by local assessors to be the total taxable value of land and additions on the property. | Land | Improvement |
|---|---|---|---|---|
| 2025 | $3,931 | $354,980 | $124,243 | $230,737 |
| 2024 | $3,903 | $348,020 | $121,807 | $226,213 |
| 2023 | $3,720 | $341,196 | $119,419 | $221,777 |
| 2022 | $3,697 | $334,505 | $117,077 | $217,428 |
| 2021 | $3,625 | $327,946 | $114,781 | $213,165 |
| 2020 | $3,577 | $324,583 | $113,604 | $210,979 |
| 2019 | $3,514 | $318,218 | $111,376 | $206,842 |
| 2018 | $3,436 | $311,978 | $109,192 | $202,786 |
| 2017 | $3,374 | $305,861 | $107,051 | $198,810 |
| 2016 | $3,155 | $299,864 | $104,952 | $194,912 |
| 2015 | $3,092 | $295,360 | $103,376 | $191,984 |
| 2014 | $3,030 | $289,574 | $101,351 | $188,223 |
Source: Public Records
Map
Nearby Homes
- 850 E Oak Hill St
- 2425 S Bon View Ave
- 2431 S Marigold Place
- 740 E Deerfield St
- 1528 1538 W Holt
- 1305 W North Pinecrest
- 891 E Cottonwood St
- 619 E Joseph Privado
- 2601 S Mildred Place
- 504 S Caldwell Ave
- 574 E Skylark Dr
- 1426 E Tam o Shanter St
- 2119 S Phoenix Place
- 1443 Doral Ct
- 2300 S Sultana Ave Unit 286
- 2300 S Sultana Ave Unit 256
- 2300 S Sultana Ave Unit 206
- 2424 S Lake Ave
- 840 E Cedar St
- 2310 S Cucamonga Ave
- 1002 E Bermuda Dunes St
- 952 E Bermuda Dunes St
- 2621 Garfield Ave
- 2621 S Garfield Ave
- 1008 E Bermuda Dunes St
- 1015 E Tam o Shanter Ct
- 2627 Garfield Ave
- 957 E Bermuda Dunes St
- 1016 E Bermuda Dunes St
- 1009 E Bermuda Dunes St
- 1007 E Tam o Shanter Ct
- 951 E Bermuda Dunes St
- 2608 S Holmes Ave
- 2608 Garfield Ave
- 2614 Garfield Ave
- 2633 Garfield Ave
- 1015 E Bermuda Dunes St
- 1021 E Tam o Shanter Ct
- 945 E Bermuda Dunes St
- 2620 Garfield Ave
Your Personal Tour Guide
Ask me questions while you tour the home.