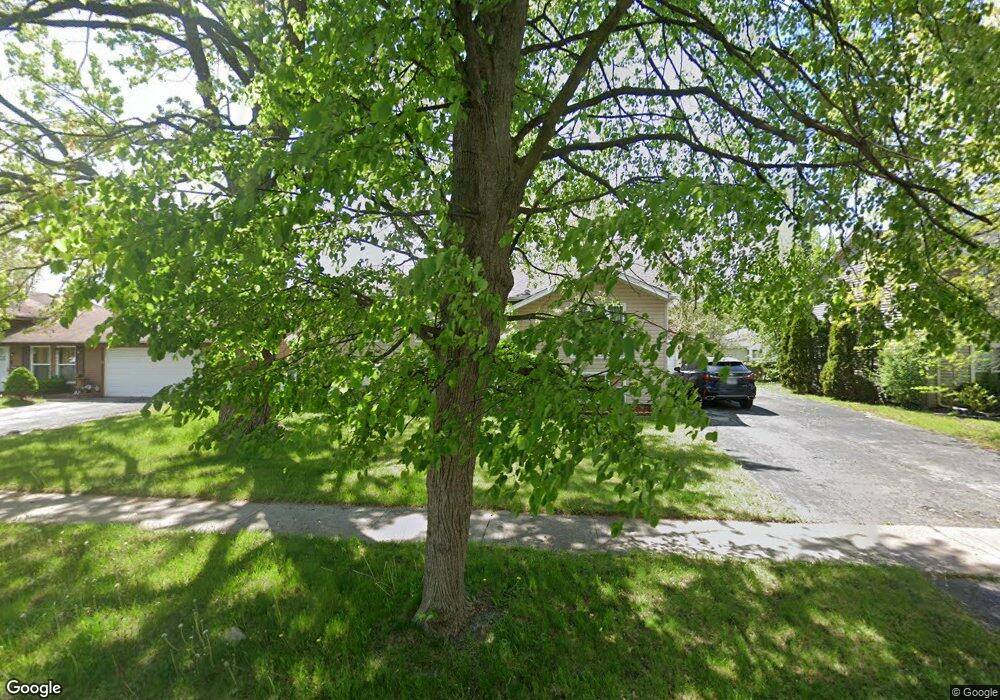
958 Purdue Ln Matteson, IL 60443
West Matteson NeighborhoodEstimated Value: $216,000 - $225,000
3
Beds
1
Bath
1,025
Sq Ft
$215/Sq Ft
Est. Value
About This Home
This home is located at 958 Purdue Ln, Matteson, IL 60443 and is currently estimated at $220,031, approximately $214 per square foot. 958 Purdue Ln is a home located in Cook County with nearby schools including Colin Powell Middle School and Southland College Prep.
Ownership History
Date
Name
Owned For
Owner Type
Purchase Details
Closed on
Nov 5, 1998
Sold by
Lassiter Catherine
Bought by
Ford Jessica D
Current Estimated Value
Home Financials for this Owner
Home Financials are based on the most recent Mortgage that was taken out on this home.
Original Mortgage
$104,141
Outstanding Balance
$21,348
Interest Rate
6.72%
Mortgage Type
FHA
Estimated Equity
$198,683
Purchase Details
Closed on
Oct 13, 1998
Sold by
Bankers Trust Company Of California Na
Bought by
Lassiter Catherine
Home Financials for this Owner
Home Financials are based on the most recent Mortgage that was taken out on this home.
Original Mortgage
$104,141
Outstanding Balance
$21,348
Interest Rate
6.72%
Mortgage Type
FHA
Estimated Equity
$198,683
Purchase Details
Closed on
Sep 22, 1994
Sold by
Va
Bought by
Vendee Mtg Trust 1994 & 3
Purchase Details
Closed on
May 31, 1994
Sold by
Va
Bought by
Lassiter Catherine M
Home Financials for this Owner
Home Financials are based on the most recent Mortgage that was taken out on this home.
Original Mortgage
$78,000
Interest Rate
8.44%
Create a Home Valuation Report for This Property
The Home Valuation Report is an in-depth analysis detailing your home's value as well as a comparison with similar homes in the area
Home Values in the Area
Average Home Value in this Area
Purchase History
| Date | Buyer | Sale Price | Title Company |
|---|---|---|---|
| Ford Jessica D | $105,000 | -- | |
| Lassiter Catherine | -- | -- | |
| Vendee Mtg Trust 1994 & 3 | -- | -- | |
| Lassiter Catherine M | -- | -- |
Source: Public Records
Mortgage History
| Date | Status | Borrower | Loan Amount |
|---|---|---|---|
| Open | Ford Jessica D | $104,141 | |
| Previous Owner | Lassiter Catherine M | $78,000 |
Source: Public Records
Tax History
| Year | Tax Paid | Tax Assessment Tax Assessment Total Assessment is a certain percentage of the fair market value that is determined by local assessors to be the total taxable value of land and additions on the property. | Land | Improvement |
|---|---|---|---|---|
| 2025 | $6,087 | $18,000 | $3,360 | $14,640 |
| 2024 | $6,087 | $18,000 | $3,360 | $14,640 |
| 2023 | $3,928 | $18,000 | $3,360 | $14,640 |
| 2022 | $3,928 | $10,757 | $2,940 | $7,817 |
| 2021 | $4,013 | $10,756 | $2,940 | $7,816 |
| 2020 | $3,997 | $10,756 | $2,940 | $7,816 |
| 2019 | $3,916 | $10,596 | $2,730 | $7,866 |
| 2018 | $3,856 | $10,596 | $2,730 | $7,866 |
| 2017 | $3,780 | $10,596 | $2,730 | $7,866 |
| 2016 | $3,915 | $10,062 | $2,520 | $7,542 |
| 2015 | $3,780 | $10,062 | $2,520 | $7,542 |
| 2014 | $3,704 | $10,062 | $2,520 | $7,542 |
| 2013 | $4,113 | $11,569 | $2,520 | $9,049 |
Source: Public Records
Map
Nearby Homes
- 5503 Georgetown Dr
- 912 Princeton Ave
- 829 Princeton Ave
- 5631 Colgate Ln
- 997 Regent Dr
- 763 Cambridge Ave
- 1010 Regent Dr
- 5327 Northwestern Dr
- 505 E Illinois St Unit 105
- 5226 Southwick Ct Unit 2
- 322 Central Ave
- 21206 Sophia Dr
- 21131 Vivienne Dr
- 21156 Christina Dr
- 5620 Feathercreek Rd
- 6021 Spring Ln
- 6037 Spring Ln
- 6216 Pond View Dr
- 6125 Sunflower Dr
- 5804 Kathryn Ln
Your Personal Tour Guide
Ask me questions while you tour the home.