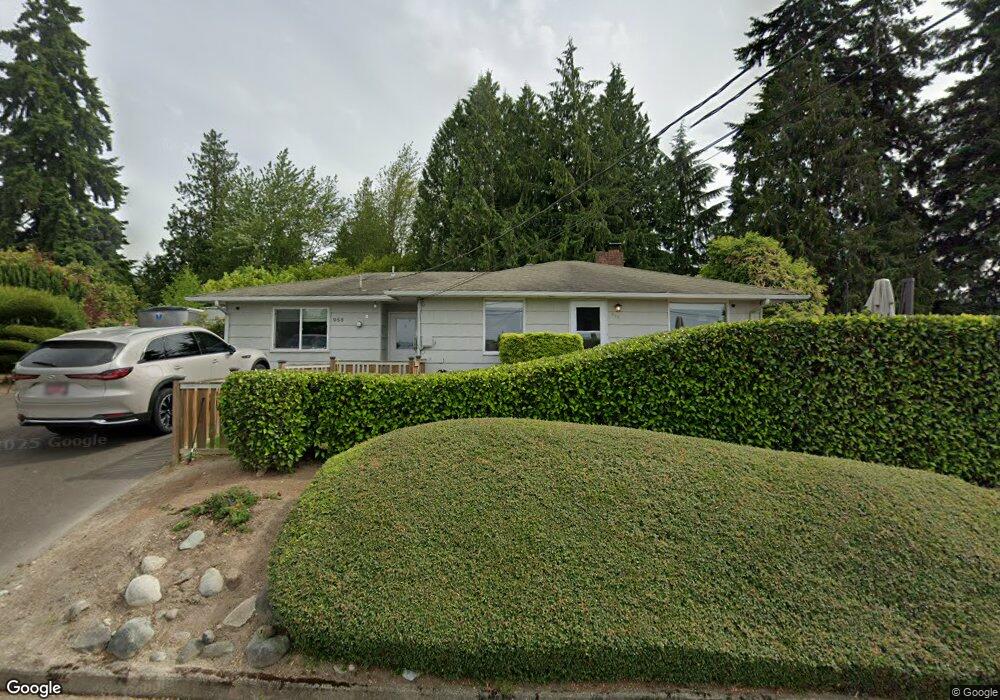
958 Sprague St Edmonds, WA 98020
Edmonds Bowl NeighborhoodEstimated Value: $1,023,147 - $1,205,000
2
Beds
1
Bath
1,248
Sq Ft
$891/Sq Ft
Est. Value
About This Home
This home is located at 958 Sprague St, Edmonds, WA 98020 and is currently estimated at $1,112,037, approximately $891 per square foot. 958 Sprague St is a home located in Snohomish County with nearby schools including Edmonds Elementary School, College Place Middle School, and Edmonds-Woodway High School.
Ownership History
Date
Name
Owned For
Owner Type
Purchase Details
Closed on
Jan 15, 2016
Sold by
Sanger Thomas E and Sanger Beth L
Bought by
Sanger Edward Thomas and Sanger Beth L
Current Estimated Value
Home Financials for this Owner
Home Financials are based on the most recent Mortgage that was taken out on this home.
Original Mortgage
$405,000
Outstanding Balance
$321,471
Interest Rate
3.9%
Mortgage Type
New Conventional
Estimated Equity
$790,566
Purchase Details
Closed on
Jul 25, 2012
Sold by
Stalker Margaret E
Bought by
Sanger Thomas E and Sanger Beth L
Home Financials for this Owner
Home Financials are based on the most recent Mortgage that was taken out on this home.
Original Mortgage
$266,250
Interest Rate
3.56%
Mortgage Type
New Conventional
Create a Home Valuation Report for This Property
The Home Valuation Report is an in-depth analysis detailing your home's value as well as a comparison with similar homes in the area
Home Values in the Area
Average Home Value in this Area
Purchase History
| Date | Buyer | Sale Price | Title Company |
|---|---|---|---|
| Sanger Edward Thomas | -- | Chicago Title | |
| Sanger Thomas E | $355,280 | Chicago Title |
Source: Public Records
Mortgage History
| Date | Status | Borrower | Loan Amount |
|---|---|---|---|
| Open | Sanger Edward Thomas | $405,000 | |
| Closed | Sanger Thomas E | $266,250 |
Source: Public Records
Tax History
| Year | Tax Paid | Tax Assessment Tax Assessment Total Assessment is a certain percentage of the fair market value that is determined by local assessors to be the total taxable value of land and additions on the property. | Land | Improvement |
|---|---|---|---|---|
| 2025 | $6,708 | $1,007,600 | $870,800 | $136,800 |
| 2024 | $6,708 | $942,800 | $806,300 | $136,500 |
| 2023 | $7,873 | $1,146,700 | $979,100 | $167,600 |
| 2022 | $7,199 | $862,000 | $719,700 | $142,300 |
| 2020 | $6,879 | $736,700 | $612,200 | $124,500 |
| 2019 | $6,678 | $720,300 | $596,400 | $123,900 |
| 2018 | $6,603 | $615,400 | $504,700 | $110,700 |
| 2017 | $5,756 | $561,300 | $459,400 | $101,900 |
| 2016 | $4,935 | $476,800 | $378,900 | $97,900 |
Source: Public Records
Map
Nearby Homes
- 647 9th Ave N
- 926 Dayton St
- 910 9th Ave N
- 217 9th Ave S
- 609 7th Ave N Unit B304
- 603 7th Ave N Unit A306
- 1021 Walnut St
- 640 Bell St
- 621 Daley St
- 816 Walnut St
- 9533 Bowdoin Way
- 712 Alder St
- 624 Alder St
- 1020 Puget Dr
- 817 Puget Way
- 546 Walnut St Unit 201
- 8732 209th Place SW
- 505 5th Ave S Unit 205
- 902 7th Ave S
- 233 3rd Ave S Unit 305
Your Personal Tour Guide
Ask me questions while you tour the home.