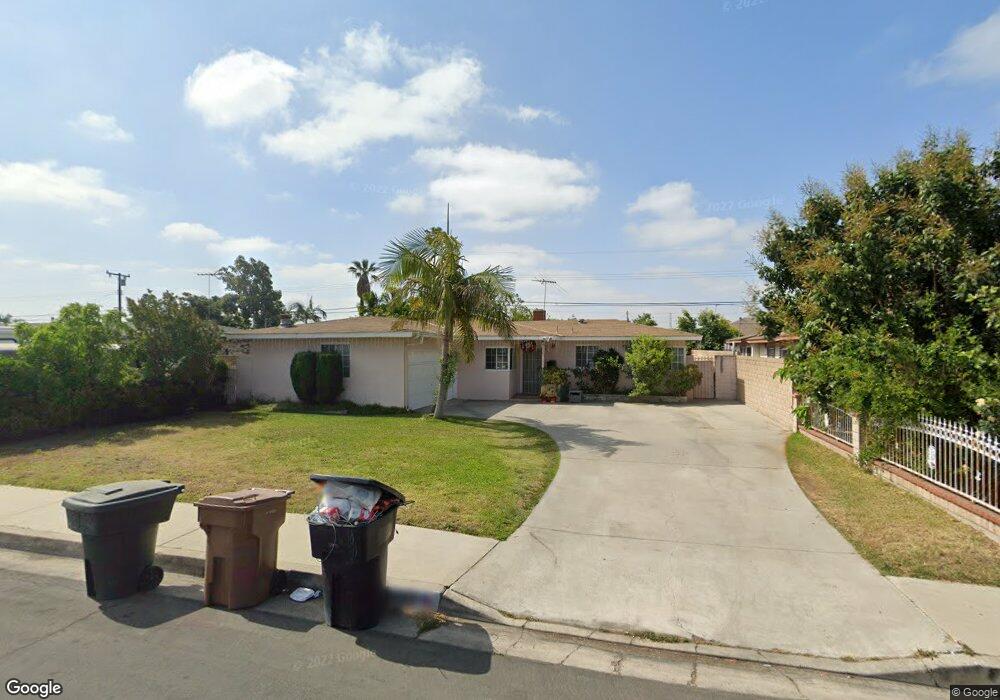
9582 Chanticleer Rd Anaheim, CA 92804
West Anaheim NeighborhoodEstimated Value: $900,000 - $959,990
3
Beds
3
Baths
1,525
Sq Ft
$611/Sq Ft
Est. Value
About This Home
This home is located at 9582 Chanticleer Rd, Anaheim, CA 92804 and is currently estimated at $931,498, approximately $610 per square foot. 9582 Chanticleer Rd is a home located in Orange County with nearby schools including Jonas E. Salk Elementary School, Dale Jr High School, and Magnolia High.
Ownership History
Date
Name
Owned For
Owner Type
Purchase Details
Closed on
Jun 13, 2012
Sold by
Ky Cuong Quoc
Bought by
Ky Nikki
Current Estimated Value
Purchase Details
Closed on
Jul 2, 2003
Sold by
Tran Henry
Bought by
Ky Cuong Quoc
Home Financials for this Owner
Home Financials are based on the most recent Mortgage that was taken out on this home.
Original Mortgage
$220,000
Interest Rate
5.22%
Mortgage Type
Purchase Money Mortgage
Purchase Details
Closed on
May 27, 2003
Sold by
Mai Hai Tuan and Mai Tuyet Thi
Bought by
Tran Henry
Home Financials for this Owner
Home Financials are based on the most recent Mortgage that was taken out on this home.
Original Mortgage
$220,000
Interest Rate
5.22%
Mortgage Type
Purchase Money Mortgage
Purchase Details
Closed on
Sep 8, 1997
Sold by
Matthew Drinkwine and Matthew Alice S
Bought by
Mai Hai Tuan and Mai Tuyet Thi
Home Financials for this Owner
Home Financials are based on the most recent Mortgage that was taken out on this home.
Original Mortgage
$125,250
Interest Rate
7.33%
Create a Home Valuation Report for This Property
The Home Valuation Report is an in-depth analysis detailing your home's value as well as a comparison with similar homes in the area
Home Values in the Area
Average Home Value in this Area
Purchase History
| Date | Buyer | Sale Price | Title Company |
|---|---|---|---|
| Ky Nikki | -- | None Available | |
| Ky Cuong Quoc | $340,000 | Orange Coast Title | |
| Tran Henry | $320,000 | Orange Coast | |
| Mai Hai Tuan | $167,000 | -- |
Source: Public Records
Mortgage History
| Date | Status | Borrower | Loan Amount |
|---|---|---|---|
| Closed | Ky Cuong Quoc | $220,000 | |
| Previous Owner | Mai Hai Tuan | $125,250 |
Source: Public Records
Tax History Compared to Growth
Tax History
| Year | Tax Paid | Tax Assessment Tax Assessment Total Assessment is a certain percentage of the fair market value that is determined by local assessors to be the total taxable value of land and additions on the property. | Land | Improvement |
|---|---|---|---|---|
| 2025 | $5,292 | $447,148 | $372,507 | $74,641 |
| 2024 | $5,292 | $438,381 | $365,203 | $73,178 |
| 2023 | $5,159 | $429,786 | $358,042 | $71,744 |
| 2022 | $5,111 | $421,359 | $351,021 | $70,338 |
| 2021 | $5,044 | $413,098 | $344,139 | $68,959 |
| 2020 | $5,026 | $408,863 | $340,611 | $68,252 |
| 2019 | $4,906 | $400,847 | $333,933 | $66,914 |
| 2018 | $4,849 | $392,988 | $327,386 | $65,602 |
| 2017 | $4,684 | $385,283 | $320,967 | $64,316 |
| 2016 | $4,662 | $377,729 | $314,674 | $63,055 |
| 2015 | $4,613 | $372,056 | $309,948 | $62,108 |
| 2014 | $4,392 | $364,768 | $303,876 | $60,892 |
Source: Public Records
Map
Nearby Homes
- 10301 Rhiems Rd
- 10301 Antigua St
- 9272 Cerritos Ave
- 2533 W Chanticleer Rd
- 9155 Pacific Ave Unit 265
- 998 S Crossbow Ln Unit 12D
- 958 S Crossbow Ln Unit 8
- 927 S Webster Ave
- 994 S Sutter Creek Rd Unit 60
- 938 S Sutter Creek Rd Unit 54
- 1250 S Brookhurst St Unit 1059
- 1250 S Brookhurst St Unit 2028
- 1250 S Brookhurst St
- 1250 S Brookhurst St Unit 2033
- 917 S Sutter Creek Rd Unit 46
- 2245 W Vancouver Dr
- 90093 Stacie Ln
- 1350 S Ashington Ln
- 8921 Kennelly Ln
- 2631 W Cerritos Ave
- 9592 Chanticleer Rd
- 9572 Chanticleer Rd
- 9581 Harriet Ln
- 9571 Harriet Ln
- 9602 Chanticleer Rd
- 9552 Chanticleer Rd
- 9591 Harriet Ln
- 10321 D Este Dr
- 10322 Bouvais Rd
- 9612 Chanticleer Rd
- 9601 Harriet Ln
- 9542 Chanticleer Rd
- 10311 D Este Dr
- 10312 Bouvais Rd
- 9541 Harriet Ln
- 9611 Harriet Ln
- 10401 Larry Dr
- 9622 Chanticleer Rd
- 9532 Chanticleer Rd