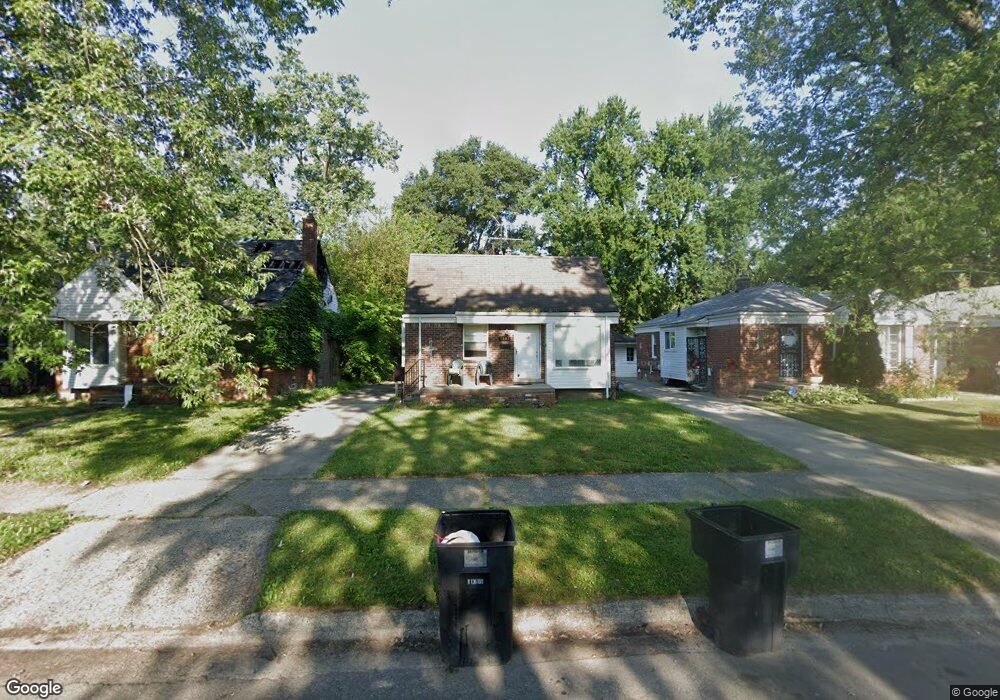
9583 Braile St Detroit, MI 48228
Franklin Park NeighborhoodEstimated Value: $90,000 - $140,000
3
Beds
2
Baths
960
Sq Ft
$119/Sq Ft
Est. Value
About This Home
This home is located at 9583 Braile St, Detroit, MI 48228 and is currently estimated at $113,869, approximately $118 per square foot. 9583 Braile St is a home located in Wayne County with nearby schools including Bates Academy, Charles L. Spain Elementary-Middle School, and Edward 'Duke' Ellington Conservatory of Music and Art.
Ownership History
Date
Name
Owned For
Owner Type
Purchase Details
Closed on
Apr 4, 2025
Sold by
Benso Capital Llc
Bought by
Metal Rooster Llc
Current Estimated Value
Purchase Details
Closed on
May 15, 2017
Sold by
Halliburton Michael E
Bought by
Owens Dariel L
Purchase Details
Closed on
Oct 21, 2004
Sold by
Precision Investment Properties Llc
Bought by
Halliburton Michael E
Purchase Details
Closed on
May 20, 2004
Sold by
Anderson Michael and Anderson Shana
Bought by
Precision Investment Properties Llc
Purchase Details
Closed on
Nov 19, 2003
Sold by
Phoenix Real Estate Co
Bought by
Anderson Michael
Purchase Details
Closed on
Jul 21, 2003
Sold by
Wm Specialty Mortgage Llc
Bought by
Phoenix Real Estate
Purchase Details
Closed on
May 23, 2003
Sold by
Washington Mutual Bank Fa
Bought by
Wm Specialty Mortgage Llc
Create a Home Valuation Report for This Property
The Home Valuation Report is an in-depth analysis detailing your home's value as well as a comparison with similar homes in the area
Home Values in the Area
Average Home Value in this Area
Purchase History
| Date | Buyer | Sale Price | Title Company |
|---|---|---|---|
| Metal Rooster Llc | -- | None Listed On Document | |
| Owens Dariel L | $1,000 | None Available | |
| Halliburton Michael E | $82,000 | -- | |
| Precision Investment Properties Llc | -- | Clearly Title | |
| Anderson Michael | $63,500 | Multiple | |
| Phoenix Real Estate | $47,000 | Metropolitan Title | |
| Wm Specialty Mortgage Llc | -- | Metropolitan Title |
Source: Public Records
Tax History Compared to Growth
Tax History
| Year | Tax Paid | Tax Assessment Tax Assessment Total Assessment is a certain percentage of the fair market value that is determined by local assessors to be the total taxable value of land and additions on the property. | Land | Improvement |
|---|---|---|---|---|
| 2025 | $1,125 | $42,300 | $0 | $0 |
| 2024 | $1,125 | $35,500 | $0 | $0 |
| 2023 | $1,090 | $28,500 | $0 | $0 |
| 2022 | $1,191 | $23,000 | $0 | $0 |
| 2021 | $1,162 | $17,700 | $0 | $0 |
| 2020 | $1,150 | $16,300 | $0 | $0 |
| 2019 | $1,133 | $14,500 | $0 | $0 |
| 2018 | $969 | $12,400 | $0 | $0 |
| 2017 | $228 | $12,000 | $0 | $0 |
| 2016 | $1,273 | $17,200 | $0 | $0 |
| 2015 | $1,720 | $17,200 | $0 | $0 |
| 2013 | $2,420 | $24,196 | $0 | $0 |
| 2010 | -- | $34,668 | $1,069 | $33,599 |
Source: Public Records
Map
Nearby Homes
- 9575 Braile St
- 9375 Pierson St
- 9935 Pierson St
- 9363 Patton St
- 9608 Fielding St
- 9328 Patton St
- 10001 Fielding St
- 9327 Stout St
- 9581 Heyden St
- 9525 Heyden St
- 9225 Patton St
- 9252 Fielding St
- 9208 Braile St
- 11359 Braile St
- 9072 Burt Rd
- 9207 Stout St
- 9319 Vaughan St
- 9074 Patton St
- 9277 Vaughan St
- 9107 Stout St
- 9582 Pierson St
- 9591 Braile St
- 9574 Pierson St
- 9590 Pierson St
- 9567 Braile St
- 9566 Pierson St Unit Bldg-Unit
- 9566 Pierson St
- 9601 Braile St
- 9600 Pierson St
- 9559 Braile St
- 9558 Pierson St
- 9607 Braile St
- 9606 Pierson St
- 9551 Braile St
- 9550 Pierson St
- 9617 Braile St
- 9620 Pierson St
- 9543 Braile St
- 9542 Pierson St
- 9535 Braile St