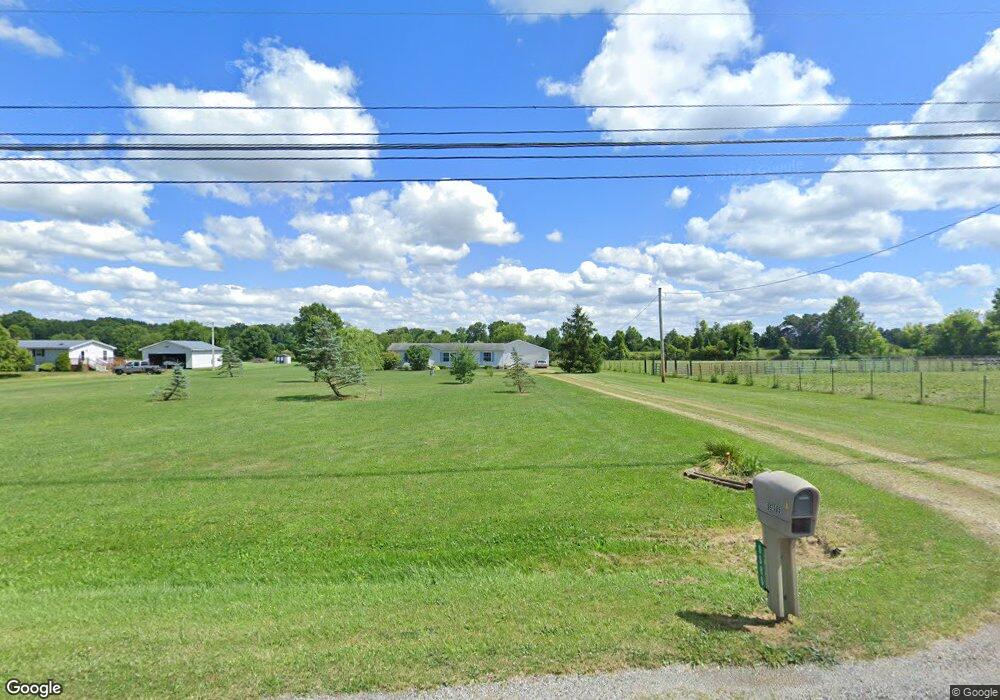
9585 Lodi Rd West Salem, OH 44287
Estimated Value: $224,000 - $322,000
3
Beds
2
Baths
1,404
Sq Ft
$197/Sq Ft
Est. Value
About This Home
This home is located at 9585 Lodi Rd, West Salem, OH 44287 and is currently estimated at $277,129, approximately $197 per square foot. 9585 Lodi Rd is a home located in Medina County with nearby schools including Cloverleaf Elementary School, Cloverleaf Middle School, and Cloverleaf High School.
Ownership History
Date
Name
Owned For
Owner Type
Purchase Details
Closed on
Aug 4, 2009
Sold by
North Star Investors Llc
Bought by
Turos Robert G
Current Estimated Value
Home Financials for this Owner
Home Financials are based on the most recent Mortgage that was taken out on this home.
Original Mortgage
$97,206
Outstanding Balance
$63,862
Interest Rate
5.36%
Mortgage Type
FHA
Estimated Equity
$213,267
Purchase Details
Closed on
Jan 8, 2009
Sold by
Secretary Of Housing
Bought by
North Star Investors Llc
Purchase Details
Closed on
Jan 10, 2008
Sold by
Huffman Arnold
Bought by
Secretary Of Housing and Urban Development
Purchase Details
Closed on
Jul 20, 2005
Sold by
Miller Randy G and Miller Holly R
Bought by
Huffman Arnold R
Home Financials for this Owner
Home Financials are based on the most recent Mortgage that was taken out on this home.
Original Mortgage
$138,040
Interest Rate
5.68%
Mortgage Type
FHA
Purchase Details
Closed on
Jun 13, 1996
Sold by
Blanton John W
Bought by
Miller Randy G and Miller Holly R
Create a Home Valuation Report for This Property
The Home Valuation Report is an in-depth analysis detailing your home's value as well as a comparison with similar homes in the area
Home Values in the Area
Average Home Value in this Area
Purchase History
| Date | Buyer | Sale Price | Title Company |
|---|---|---|---|
| Turos Robert G | $99,000 | -- | |
| North Star Investors Llc | -- | -- | |
| Secretary Of Housing | -- | -- | |
| Huffman Arnold R | $145,500 | -- | |
| Miller Randy G | $19,500 | -- |
Source: Public Records
Mortgage History
| Date | Status | Borrower | Loan Amount |
|---|---|---|---|
| Open | Turos Robert G | $97,206 | |
| Previous Owner | Huffman Arnold R | $138,040 |
Source: Public Records
Tax History Compared to Growth
Tax History
| Year | Tax Paid | Tax Assessment Tax Assessment Total Assessment is a certain percentage of the fair market value that is determined by local assessors to be the total taxable value of land and additions on the property. | Land | Improvement |
|---|---|---|---|---|
| 2024 | $2,149 | $65,290 | $17,050 | $48,240 |
| 2023 | $2,149 | $65,290 | $17,050 | $48,240 |
| 2022 | $2,253 | $65,290 | $17,050 | $48,240 |
| 2021 | $1,751 | $51,420 | $13,430 | $37,990 |
| 2020 | $1,783 | $51,420 | $13,430 | $37,990 |
| 2019 | $1,793 | $51,420 | $13,430 | $37,990 |
| 2018 | $1,329 | $38,950 | $13,520 | $25,430 |
| 2017 | $1,331 | $38,950 | $13,520 | $25,430 |
| 2016 | $1,354 | $38,950 | $13,520 | $25,430 |
| 2015 | $1,279 | $36,750 | $12,750 | $24,000 |
| 2014 | $1,232 | $36,750 | $12,750 | $24,000 |
| 2013 | $1,135 | $36,750 | $12,750 | $24,000 |
Source: Public Records
Map
Nearby Homes
- 9835 Congress Rd
- 10044 Franchester Rd
- 0 Repp Rd
- 120 Sunset
- 120 Sunset Unit 28
- 607 Bank St
- 10933 SiMcOx Rd
- 133 S Broadway St
- 125 Bank St
- 0 Cemetery Rd
- 221 N Market St
- 8620 Willow Rd
- 207 Gaylord St
- 111 Anderson Cove
- 106 Anderson Cove Unit 206
- 220 Gaylord St
- 720 Medina St
- 419 Young Dr
- 507 Creek Bend Trail
- 131 Mill St
- 9555 Lodi Rd
- 9544 Lodi Rd
- 9595 Lodi Rd
- 9533 Lodi Rd
- 9530 Lodi Rd Unit 9538
- 9667 Congress Rd
- 9520 Congress Rd
- 9569 Congress Rd
- 9545 Congress Rd
- 9534 Congress Rd
- 9550 Congress Rd
- 9574 Congress Rd
- 9588 Congress Rd
- 9610 Congress Rd
- 9595 Congress Rd
- 9626 Congress Rd
- 9685 Congress Rd
- 9680 Congress Rd
- 10195 Crawford Rd
- 9489 Congress Rd