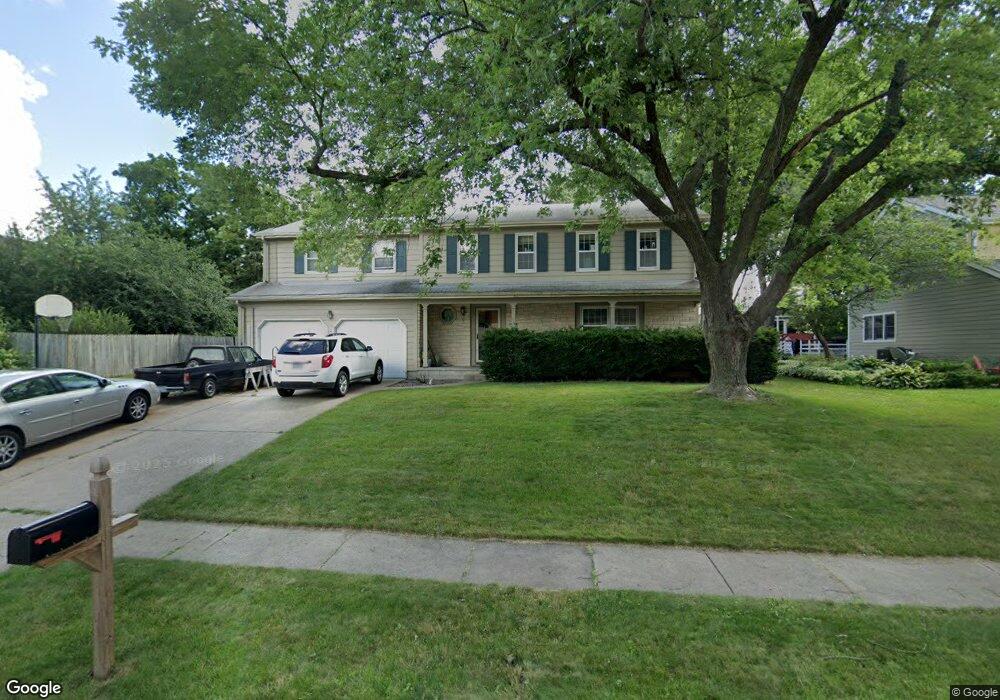
959 40th St West Des Moines, IA 50265
Estimated Value: $377,330 - $432,000
5
Beds
4
Baths
2,426
Sq Ft
$163/Sq Ft
Est. Value
About This Home
This home is located at 959 40th St, West Des Moines, IA 50265 and is currently estimated at $395,833, approximately $163 per square foot. 959 40th St is a home located in Polk County with nearby schools including Western Hills Elementary School, Stilwell Junior High School, and Valley Southwoods Freshman High School.
Ownership History
Date
Name
Owned For
Owner Type
Purchase Details
Closed on
Jun 11, 2001
Sold by
Saibini Albert M and Saibini Lynda
Bought by
Johnson Dale M and Johnson Virginia R
Current Estimated Value
Home Financials for this Owner
Home Financials are based on the most recent Mortgage that was taken out on this home.
Original Mortgage
$105,000
Outstanding Balance
$39,439
Interest Rate
7.11%
Estimated Equity
$356,394
Purchase Details
Closed on
Oct 14, 1999
Sold by
Heim Phillip A and Heim Jill A
Bought by
Saibini Albert M and Saibini Lynda
Home Financials for this Owner
Home Financials are based on the most recent Mortgage that was taken out on this home.
Original Mortgage
$148,869
Interest Rate
6.87%
Purchase Details
Closed on
Sep 19, 1998
Sold by
Smith Dennis A and Smith Janene A
Bought by
Heim Phillip F and Heim Jill A
Home Financials for this Owner
Home Financials are based on the most recent Mortgage that was taken out on this home.
Original Mortgage
$162,637
Interest Rate
7.02%
Mortgage Type
VA
Create a Home Valuation Report for This Property
The Home Valuation Report is an in-depth analysis detailing your home's value as well as a comparison with similar homes in the area
Home Values in the Area
Average Home Value in this Area
Purchase History
| Date | Buyer | Sale Price | Title Company |
|---|---|---|---|
| Johnson Dale M | $161,500 | -- | |
| Saibini Albert M | $156,500 | -- | |
| Heim Phillip F | $157,500 | -- |
Source: Public Records
Mortgage History
| Date | Status | Borrower | Loan Amount |
|---|---|---|---|
| Open | Johnson Dale M | $105,000 | |
| Previous Owner | Saibini Albert M | $148,869 | |
| Previous Owner | Heim Phillip F | $162,637 |
Source: Public Records
Tax History Compared to Growth
Tax History
| Year | Tax Paid | Tax Assessment Tax Assessment Total Assessment is a certain percentage of the fair market value that is determined by local assessors to be the total taxable value of land and additions on the property. | Land | Improvement |
|---|---|---|---|---|
| 2025 | $5,170 | $378,500 | $76,800 | $301,700 |
| 2024 | $5,170 | $336,700 | $67,200 | $269,500 |
| 2023 | $5,236 | $336,700 | $67,200 | $269,500 |
| 2022 | $5,172 | $280,000 | $57,400 | $222,600 |
| 2021 | $5,084 | $280,000 | $57,400 | $222,600 |
| 2020 | $5,004 | $262,100 | $53,700 | $208,400 |
| 2019 | $4,750 | $262,100 | $53,700 | $208,400 |
| 2018 | $4,758 | $240,400 | $47,800 | $192,600 |
| 2017 | $4,398 | $240,400 | $47,800 | $192,600 |
| 2016 | $4,298 | $216,600 | $42,500 | $174,100 |
| 2015 | $4,298 | $216,600 | $42,500 | $174,100 |
| 2014 | $3,868 | $199,600 | $38,500 | $161,100 |
Source: Public Records
Map
Nearby Homes
- 3931 Ashworth Rd
- 909 39th St
- 1007 Marcourt Ln
- 942 42nd St
- 3701 Aspen Dr
- 1035 Belle Mar Dr
- 3905 Francrest Dr
- 4300 Pommel Place
- 3500 Brookview Dr
- 1100 42nd St
- 4830 Cedar Dr Unit 86
- 1010 32nd St
- 1101 33rd St
- 724 46th Place
- 4533 Woodland Ave Unit 2
- 4609 Woodland Ave Unit 5
- 3204 Vine St
- 4549 Woodland Ave Unit 4
- 400 38th St
- 636 47th St