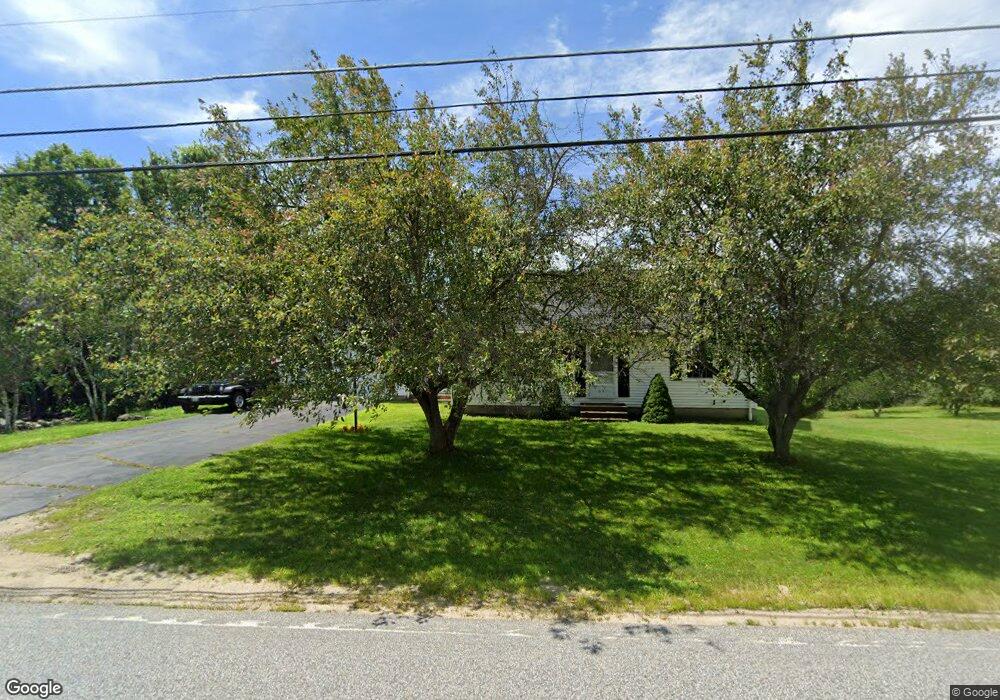
959 Back Rd Shapleigh, ME 04076
Estimated Value: $399,000
--
Bed
--
Bath
864
Sq Ft
$462/Sq Ft
Est. Value
About This Home
This home is located at 959 Back Rd, Shapleigh, ME 04076 and is currently estimated at $399,000, approximately $461 per square foot. 959 Back Rd is a home with nearby schools including Massabesic High School.
Ownership History
Date
Name
Owned For
Owner Type
Purchase Details
Closed on
Sep 8, 2017
Sold by
Anderson Francis L Est and Ferguson
Bought by
Ford Steven M
Current Estimated Value
Home Financials for this Owner
Home Financials are based on the most recent Mortgage that was taken out on this home.
Original Mortgage
$148,050
Outstanding Balance
$123,106
Interest Rate
3.92%
Mortgage Type
New Conventional
Estimated Equity
$275,894
Create a Home Valuation Report for This Property
The Home Valuation Report is an in-depth analysis detailing your home's value as well as a comparison with similar homes in the area
Home Values in the Area
Average Home Value in this Area
Purchase History
| Date | Buyer | Sale Price | Title Company |
|---|---|---|---|
| Ford Steven M | -- | -- | |
| Ford Steven M | -- | -- | |
| Ford Steven M | -- | -- |
Source: Public Records
Mortgage History
| Date | Status | Borrower | Loan Amount |
|---|---|---|---|
| Open | Ford Steven M | $148,050 | |
| Closed | Ford Steven M | $148,050 |
Source: Public Records
Tax History Compared to Growth
Tax History
| Year | Tax Paid | Tax Assessment Tax Assessment Total Assessment is a certain percentage of the fair market value that is determined by local assessors to be the total taxable value of land and additions on the property. | Land | Improvement |
|---|---|---|---|---|
| 2024 | $2,102 | $174,462 | $48,660 | $125,802 |
| 2023 | $1,849 | $174,462 | $48,660 | $125,802 |
| 2022 | $1,797 | $174,462 | $48,660 | $125,802 |
| 2021 | $1,788 | $174,462 | $48,660 | $125,802 |
| 2020 | $1,788 | $174,462 | $48,660 | $125,802 |
| 2019 | $1,771 | $174,462 | $48,660 | $125,802 |
| 2018 | $1,719 | $155,569 | $43,803 | $111,766 |
| 2017 | $1,661 | $155,569 | $43,803 | $111,766 |
| 2016 | $1,602 | $155,569 | $43,803 | $111,766 |
| 2015 | $1,556 | $155,569 | $43,803 | $111,766 |
| 2014 | $1,501 | $155,569 | $43,803 | $111,766 |
Source: Public Records
Map
Nearby Homes