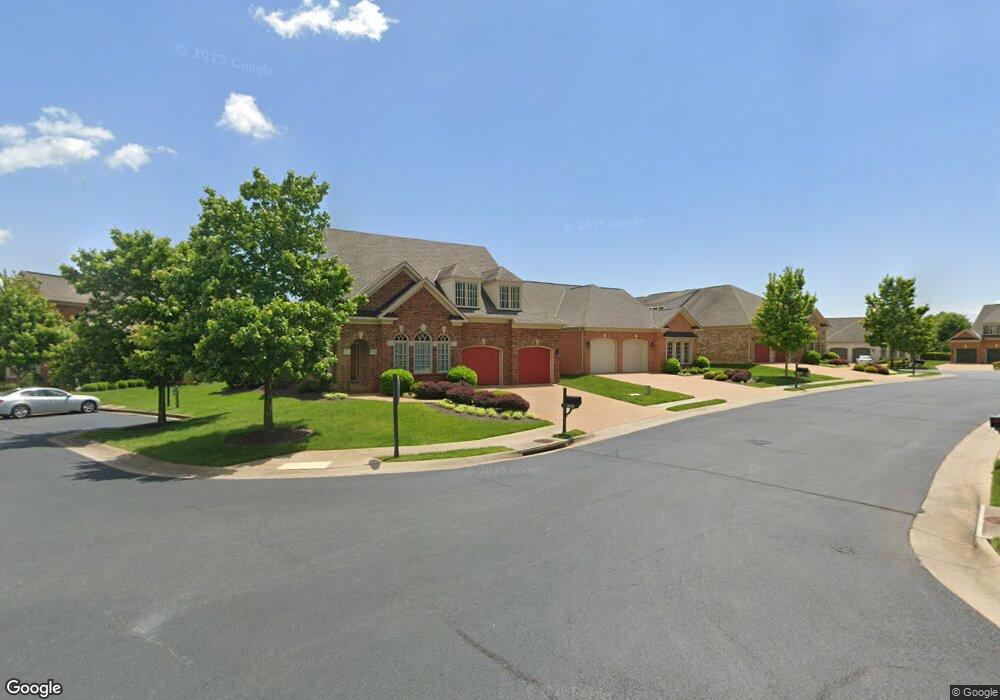
959 Belva Ln Unit 41 Glen Allen, VA 23059
Twin Hickory NeighborhoodEstimated Value: $688,127 - $739,000
3
Beds
3
Baths
2,821
Sq Ft
$256/Sq Ft
Est. Value
About This Home
This home is located at 959 Belva Ln Unit 41, Glen Allen, VA 23059 and is currently estimated at $722,032, approximately $255 per square foot. 959 Belva Ln Unit 41 is a home located in Henrico County with nearby schools including Twin Hickory Elementary School, Holman Middle School, and Deep Run High School.
Ownership History
Date
Name
Owned For
Owner Type
Purchase Details
Closed on
Jun 19, 2023
Sold by
David E Clower Revocable Trust
Bought by
Mawyer William Ivar and Mawyer Deborah Cannon
Current Estimated Value
Purchase Details
Closed on
Aug 19, 2019
Sold by
Clower David E
Bought by
Clower David E and The David E Clower Revocable T
Home Financials for this Owner
Home Financials are based on the most recent Mortgage that was taken out on this home.
Original Mortgage
$75,000
Interest Rate
3.7%
Mortgage Type
New Conventional
Purchase Details
Closed on
Aug 13, 2019
Sold by
Mcsweeney Martha S
Bought by
Clower David E
Home Financials for this Owner
Home Financials are based on the most recent Mortgage that was taken out on this home.
Original Mortgage
$75,000
Interest Rate
3.7%
Mortgage Type
New Conventional
Create a Home Valuation Report for This Property
The Home Valuation Report is an in-depth analysis detailing your home's value as well as a comparison with similar homes in the area
Home Values in the Area
Average Home Value in this Area
Purchase History
| Date | Buyer | Sale Price | Title Company |
|---|---|---|---|
| Mawyer William Ivar | $650,000 | Old Republic National Title In | |
| Clower David E | -- | None Available | |
| Clower David E | $515,000 | Stewart Title Guaranty Co |
Source: Public Records
Mortgage History
| Date | Status | Borrower | Loan Amount |
|---|---|---|---|
| Previous Owner | Clower David E | $75,000 |
Source: Public Records
Tax History Compared to Growth
Tax History
| Year | Tax Paid | Tax Assessment Tax Assessment Total Assessment is a certain percentage of the fair market value that is determined by local assessors to be the total taxable value of land and additions on the property. | Land | Improvement |
|---|---|---|---|---|
| 2025 | $5,365 | $619,000 | $145,000 | $474,000 |
| 2024 | $5,365 | $608,000 | $145,000 | $463,000 |
| 2023 | $5,168 | $608,000 | $145,000 | $463,000 |
| 2022 | $4,473 | $526,200 | $135,000 | $391,200 |
| 2021 | $4,220 | $485,000 | $125,000 | $360,000 |
| 2020 | $4,220 | $485,000 | $125,000 | $360,000 |
| 2019 | $4,220 | $485,000 | $125,000 | $360,000 |
| 2018 | $4,342 | $499,100 | $125,000 | $374,100 |
| 2017 | $4,342 | $499,100 | $125,000 | $374,100 |
| 2016 | $4,143 | $476,200 | $110,000 | $366,200 |
| 2015 | $3,969 | $466,200 | $100,000 | $366,200 |
| 2014 | $3,969 | $456,200 | $90,000 | $366,200 |
Source: Public Records
Map
Nearby Homes
- 5012 Park Commons Loop
- 5004 Parkcrest Ct
- 4912 Parkcrest Ct
- 5132 Park Commons Loop
- 918 Jamerson Ln Unit 918
- 5046 Willows Green Rd
- 11944 Belmont Park Ct
- 305 Jamerson Ct
- 11532 Saddleridge Rd
- 11141 Opaca Ln
- 4905 Old Millrace Place
- 11700 Autumnwood Ct
- 11539 Sadler Grove Rd
- 5004 Sadler Place Terrace
- 4831 Cedar Branch Ct
- 0 Manakin Rd Unit VAGO2000320
- 11012 Ellis Meadows Ln
- 12109 Oxford Landing Dr Unit 201
- 12109 Oxford Landing Dr Unit 102
- 11408 Maple Hill Place
- 959 Belva Ln
- 955 Belva Ln Unit 40
- 955 Belva Ln
- 5101 Belva Rd
- 951 Belva Ln Unit 39
- 951 Belva Ln
- 917 Belva Ln Unit 38
- 917 Belva Ln
- 5105 Belva Rd
- 1001 Belva Ct
- 1001 Belva Ct Unit 1
- 913 Belva Ln
- 960 Belva Ln
- 956 Belva Ln Unit 19
- 956 Belva Ln
- 909 Belva Ln Unit 36
- 909 Belva Ln
- 5109 Belva Rd
- 952 Belva Ln
- 11155 Nuckols Rd