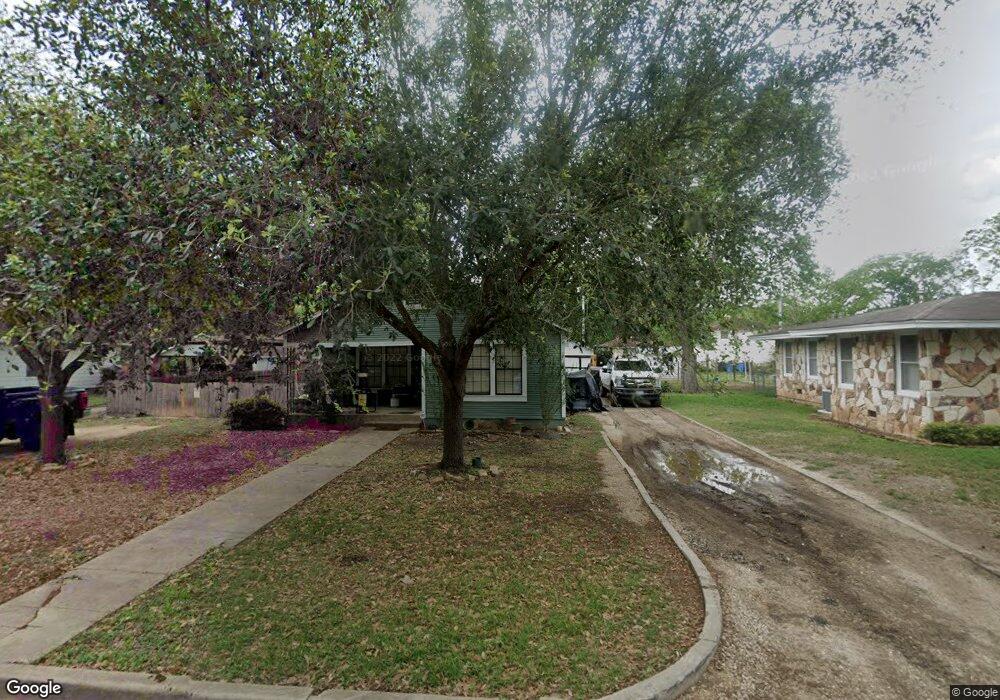
959 Bismark St Seguin, TX 78155
Estimated Value: $170,000 - $208,000
3
Beds
1
Bath
1,176
Sq Ft
$164/Sq Ft
Est. Value
About This Home
This home is located at 959 Bismark St, Seguin, TX 78155 and is currently estimated at $193,446, approximately $164 per square foot. 959 Bismark St is a home located in Guadalupe County with nearby schools including Koennecke Elementary School, Jim Barnes Middle School, and Seguin High School.
Ownership History
Date
Name
Owned For
Owner Type
Purchase Details
Closed on
Apr 17, 2014
Sold by
Keller Margaret C
Bought by
Ermel William F and Ermel Rosemary
Current Estimated Value
Purchase Details
Closed on
Mar 25, 2008
Sold by
Goodwin John Kaleb and Helms Goodwin Jenny
Bought by
Keller Margaret C
Home Financials for this Owner
Home Financials are based on the most recent Mortgage that was taken out on this home.
Original Mortgage
$104,672
Interest Rate
5.72%
Mortgage Type
Purchase Money Mortgage
Purchase Details
Closed on
Nov 2, 2005
Sold by
Moreno Carlos and Moreno Cynthia
Bought by
Goodwin John Kaleb
Home Financials for this Owner
Home Financials are based on the most recent Mortgage that was taken out on this home.
Original Mortgage
$79,994
Interest Rate
5.75%
Mortgage Type
FHA
Create a Home Valuation Report for This Property
The Home Valuation Report is an in-depth analysis detailing your home's value as well as a comparison with similar homes in the area
Home Values in the Area
Average Home Value in this Area
Purchase History
| Date | Buyer | Sale Price | Title Company |
|---|---|---|---|
| Ermel William F | -- | None Available | |
| Keller Margaret C | -- | Fatco Seguin | |
| Goodwin John Kaleb | -- | Seguin Title Company |
Source: Public Records
Mortgage History
| Date | Status | Borrower | Loan Amount |
|---|---|---|---|
| Previous Owner | Keller Margaret C | $104,672 | |
| Previous Owner | Goodwin John Kaleb | $79,994 |
Source: Public Records
Tax History Compared to Growth
Tax History
| Year | Tax Paid | Tax Assessment Tax Assessment Total Assessment is a certain percentage of the fair market value that is determined by local assessors to be the total taxable value of land and additions on the property. | Land | Improvement |
|---|---|---|---|---|
| 2025 | $2,362 | $152,359 | $42,857 | $109,502 |
| 2024 | $2,362 | $145,200 | $44,955 | $123,091 |
| 2023 | $2,362 | $121,000 | $43,052 | $77,948 |
| 2022 | $2,518 | $119,000 | $29,560 | $89,440 |
| 2021 | $2,151 | $94,000 | $20,867 | $73,133 |
| 2020 | $2,183 | $95,000 | $18,126 | $76,874 |
| 2019 | $2,270 | $96,894 | $15,185 | $81,709 |
| 2018 | $2,238 | $95,617 | $11,628 | $83,989 |
| 2017 | $2,196 | $93,594 | $11,628 | $81,966 |
| 2016 | $2,196 | $93,600 | $11,628 | $81,972 |
| 2015 | $2,196 | $89,496 | $10,260 | $79,236 |
| 2014 | $1,822 | $81,579 | $10,260 | $71,319 |
Source: Public Records
Map
Nearby Homes
- 906 E Cedar St
- 717 N Heideke St
- 1008 E College St
- 735 E Krezdorn St
- 704 E Krezdorn St
- 502 N Cherry St
- TBD E Pine St
- 725 E Pine St
- 263 N Bauer St
- TBA Pine & King St
- 1318 N San Marcos St
- 431 Gravel St
- Tract 1 Highway 90
- 631 E Ireland St
- 414 Ellis St
- 411 Ellis St
- 530 E Weinert St
- 4425 Highway 90
- 615 Elm St
- 1137 Renee Way
- 963 Bismark St
- 956 Bismark St
- 953 Bismark St
- 965 Bismark St
- 964 Bismark St
- 912 N Cherry St
- 952 Bismark St
- 967 Bismark St
- 962 E Humphreys St
- 913 Bismark St
- 966 Bismark St
- 970 E Humphreys St
- 928 Bismark St
- 952 E Humphreys St
- 922 E Humphreys St
- 920 Bismark St
- 1003 Bismark St
- 1002 Bismark St
- 953 E Cedar St
- 919 Bismark St